Posts

Showing posts from May, 2022

Quick Financial Review of BlackBerry ($BB)

Image
This is a short (Flash) financial review of the company Blackberry.   Dropping revenue ... 2022 looks good thus far as we have only passed Q1.  but I have concerns about operating profit FCF is only 8.8% from 10 years. based on PE of 315.9, it does seem overvalued Income statement - profits (2022) came from non-core business - that is other non-operating income.  thus, I do have some concerns about the core business.  Though 2022 has 1Q, though there is good gross profit and GP margin, there are concerns about operating expenses. Net assets are dropping and retained earnings are dropping.  The common stock is increasing - share dilution > not good. The cash flow > cash from operations has been dropping, it managed to barely touch black because of cash from investing $222M. This is just based on a short review of the financials - will need to jump into their annual and quarterly reports to better qualify other aspects like market, solutions development, CAPEX, competitive advantag

Preview of week starting 30May2022

Image
Another week awaits us.  The US opens on Tuesday as they celebrate Memorial Day on 30 May 2022 (Monday).  In Asia, Hong Kong & China will also have a short week as they close on 03 June 2022 for the Dragon Boat Festival. Holidays 30 May 2022 - US "Memorial Day" 03 Jun 2022 - Hong Kong & China "Dragon Boat Festival" News Recap of the previous week Baidu continues to blaze a trail in Robotaxi in China with Apollo Go providing 196,000 rides in Q1/2022 (up 11,000% year on year).  They have arrived in Wuhan following successful launches in Beijing, Guangzhou, Shanghai and Shenzhen. Burry's view on market crash and fake rallies Michael J. Burry has shared his views about the market crashes and "fake" rallies. Market ended in extreme fear with the ending of week 22 May 2022 From the Fear & Greed index, the sentiment of "extreme fear" remains in the market.  This is likely to continue in the coming week.  Hopefully, we can find some relie

Earnings Review of Alibaba dated 26May2022 - has the giant awakened?

Image
Alibaba released its recent earnings on 26 May 2022.  I will focus more on YoY performance in this review as this would provide a more balanced overview of the progress. Latest Earnings beat for Q1/2022  Here is the extract from their earnings report pertaining their fiscal year ended March 31, 2022: Revenue was RMB853,062 million (US$134,567 million), an increase of 19% year-over-year that was primarily driven by the revenue growth of the China commerce segment by 18% year-over-year to RMB592,705 million (US$93,497 million), Cloud segment by 23% year-over-year to RMB74,568 million (US$11,763 million) and International commerce segment by 25% year-over-year to RMB61,078 million (US$9,635 million). Excluding the consolidation of Sun Art, our revenue would have grown 14% year-over-year to RMB770,734 million (US$121,580 million). Income from operations was RMB69,638 million (US$10,985 million), a decrease of 22% year- over-year . Excluding one-off and certain other items as identified in

S&P 500 - have we passed the bottom? what can we see from the technicals?

Image
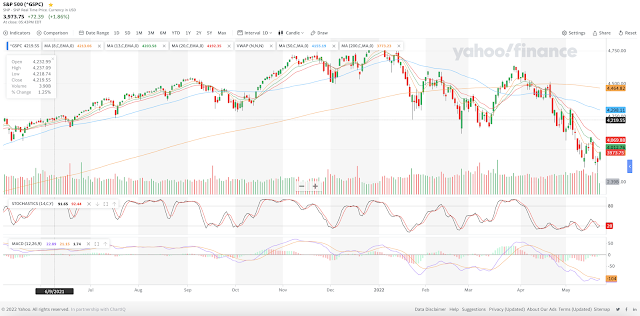
S&P ended the trading day of 24 May 2022 with a +1.86% to close at 3,973.75.  It was up from the recent low of 3,900. 1D chart of S&P500 Using the technical indicators, there are signs of possible reversal but both stochastic and MACD indicators have yet to confirm a reversal as we seek a clear cross over at the bottom .  Looking at the volume, 24 May 2022 closed with a much lower volume of 2.38B compared to the average of 4.18B daily volume.  Though there was much lower trading volume with most buying, this led to the rally of 72 points. Despite the rally, the lack of volume implies that the strength of this may not be "strong".  Volume indicates the "strength" of the trend. Technical analysis of S&P500 1D chart From the technical analysis, the moving averages (both simple and exponential) show a short term "buy" but overall, 9 out of 12 moving averages (75%) still indicate a "sell" market.  Looking at the other technical indicators,

Burry warns of crash and my views on this

Image
'Big Short' investor Michael Burry warns stocks will crash and rallies won't last. Here's a roundup of his recent tweets and what they mean.   Michael J. Burry photo - extracted from insider article Burry's book shelf - what he reads Source: https://markets.businessinsider.com/news/stocks/big-short-michael-burry-tweets-stock-market-bubble-crash-rallies-2022-5   Key quotes from the article: When the S&P 500 has crashed in the past, it has traded lower several years later, Burry noted. He pointed to the index bottoming 13% lower in 2009 than it did in 2002, 17% lower in 2002 than it did during the Long-Term Capital Management fiasco in 1998, and 10% lower in 1975 than in 1970.   Burry noted that 12 of the 20 largest one-day rallies in the Nasdaq index took place as the dot-com bubble burst, while nine of the S&P 500's 20 biggest one-day rallies occurred in the aftermath of the Great Crash in 1929.   He noted that after the dot-com bubble burst, th

Preview of the week starting 23May2022

Image
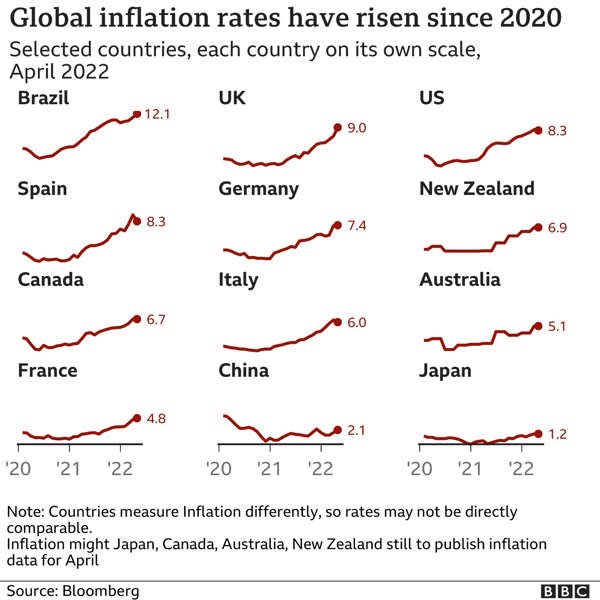
Holidays Nil for Singapore, Hong Kong, China & USA  News Summary for the week ending 22 May 2022 Fish and chips are among the most common dishes in the UK, which is deeply dependent on imports from Ukraine and Russia. According to NFFF officials, around 40% of the industry's cod and haddock come from Russia, and 50% of its sunfloweroil is from Ukraine. The UN warns that 49 million people across 43 nations are facing emergency levels of hunger. The UN Secretary-General says the crisis in Ukraine will have lasting implications around the world. Inflation of global economies since 2020 From the charts above, most major economies are fighting inflation since 2020.  Only China is seeing a downward trend for inflation.   China continues to record a net inflow of cross-border capital in April 2022. Recession taunts the market as earnings disappoint.  It may not be a taunting as we could well be part of the recession.  Mr Powell signalled on Tuesday that the central bank was likely to

Buffett Indicator and recession

Image
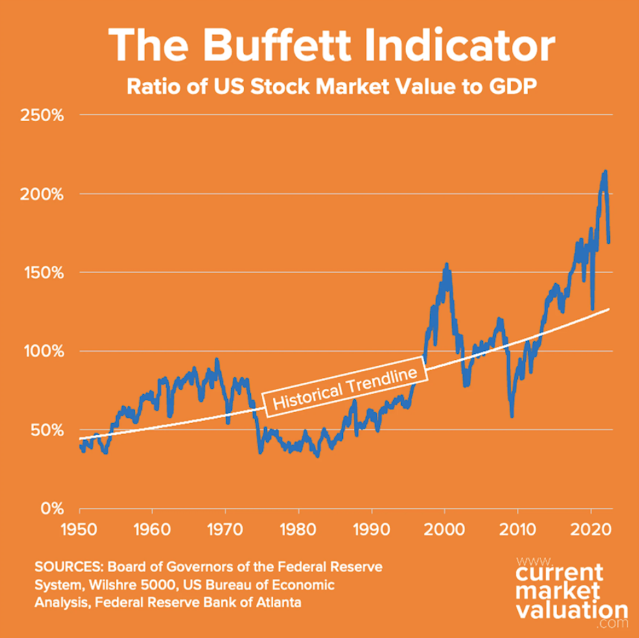
  Buffett Indicator as of 20 May 2022. The Buffett Indicator is the ratio of total United States stock market valuation to GDP. As of May 20, 2022 we calculate the Buffett Indicator as: Aggregate US Market Value: $41.7T Annualized GDP: $24.7T Buffett Indicator: $41.7T ÷ $24.7T = 169% Buffett Indicator from currentmarketvaluation.com as of 13May22 By our calculation that is currently 29% (or about 0.9 standard deviations) above the historical average, suggesting that the market is Fairly Valued.   We are coming off historical highs for this indicator. While we wait for Q2/2022 GDP results due in Q3, another decline will confirm that the market is in a technical recession. From the recent earnings and situations, we are already in a recession. While there are several ones who called out that the downtrend has reached a bottom. It would be prudent to be observing more. It is not over till the fat lady sings and we have yet to see the single "collapse" event or subsequent rippli

Technical Analysis of selected stocks (1D chart) - Sea, ICBC, Coupang, TSM & Tesla (as of 15May2022)

Image
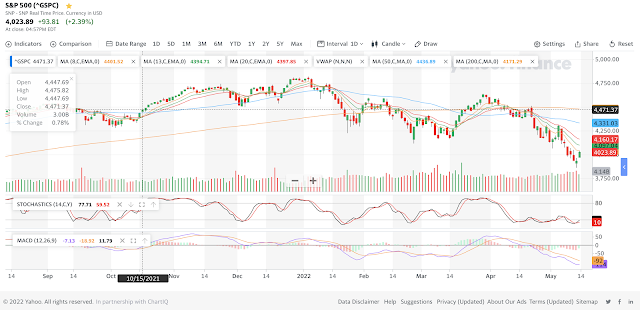
Before I start, let us not forget that we will need to qualify the business first through reviews of its fundamentals over a good period of time.  Its recovery from the ongoing pandemic can give us assurance on the quality of the businesses and the durable competitive advantages that it owns.  Let me look at the macro market as this will affect the technicals. S&P 500 1D chart as of 14 May 2022 In mid-March 2022, we identified a  death cross  (intersection of the Moving Average 50 & 200 lines where the MA 50 cuts MA 200 from above, a usually bearish indicator) using the 1D chart. From the technical indicators, the 1D chart of S&P 500 looks to be hitting the bottom soon.  The Stochastic seems to have bottomed up and a reversal seems to be in place.  The MACD indicator shows that the decline has yet to bottom up and there could be more room to go down.  Till the reversal in MACD is completed, I prefer prudence and assume the decline could continue despite the reprieve on Frid

Preview for week starting 16 May 2022

Image
Preview of the week starting 16May2022 Holidays None for the US, China and Hong Kong.   Singapore is closed for the Vesak Day holiday on 16 May 2022. News Summary (from last week) $200B crypto wiped out in 24 hours The Fed needs to prioritize timely and adequate measures to navigate away from inflation and recession . Without this, this could pave the way for China to replace the USA as the leading economy. Traders’ flight from risky investments has halved the price of bitcoin and other cryptocurrencies, wiping out more than $1 trillion worth of digital money since November. $200 billion was wiped off from Crypto Market in 24 hours... Cryptic. The US crossed the "unwanted" milestone of over 1 million Covid related deaths as cases rise in different states. Gas prices in USA - Statista The price of fuel in the U.S. is climbing as markets remain in turmoil following Russia’s military operation in Ukraine. Additionally, the Biden administration’s embargo on Russian oil may be an