Posts

Showing posts with the label technical analysis

Quick Look - is LVMH worth a shot?

Image
  Who is LVMH? This is the profile of LVMH from Yahoo Finance: LVMH Moët Hennessy - Louis Vuitton, Société Européenne operates as a luxury goods company worldwide. The company offers champagnes, wines, and spirits under the Clos des Lambrays, Château d'Yquem, Dom Pérignon, Ruinart, Moët & Chandon, Hennessy, Veuve Clicquot, Château Galoupet, Ardbeg, Château Cheval Blanc, Glenmorangie, Krug, Mercier, Chandon, Cape Mentelle, Joseph Phelps, Newton Vineyard, Cloudy Bay, Belvedere, Terrazas de los Andes, Bodega Numanthia, Cheval des Andes, Woodinville, Ao Yun, Clos19, Volcan de mi Tierra, and Eminente brands; and fashion and leather products under the Loewe, Moynat, Louis Vuitton, Berluti, RIMOWA, Patou, Loro Piana, FENDI, Celine, Christian Dior, Emilio Pucci, Givenchy, Kenzo, and Marc Jacobs brands. It also provides perfumes and cosmetics under the Stella by Stella Mccartney, Officine Universelle Buly, Guerlain, Acqua di Parma, Parfums Christian Dior, Givenchy Parfums, Perfumes Loew...

Hedging for volatility (27Apr2023)

Image
  What is hedging? Fidelity defines the following hedging: Hedging is an advanced risk management strategy that involves buying or selling an investment to potentially help reduce the risk of loss of an existing position. Investopedia has the following definition: Hedging techniques  generally involve the use of financial instruments known as derivatives . Two of the most common derivatives are options and futures. With derivatives, you can develop trading strategies where a loss in one investment is offset by a gain in a derivative. Magolorean states the following as common hedging strategies: There are three common hedging strategies:  diversification, options trading, and futures contracts . Each strategy has its own advantages and disadvantages depending on your individual needs and goals as an investor (Below are some suggestions about hedging when I asked ChatGPT.) Diversification : One of the simplest and most effective ways to hedge a portfolio is through diversif...

Technical analysis of Tesla 1D chart (21Aug22) - has Tesla peaked for now?

Image
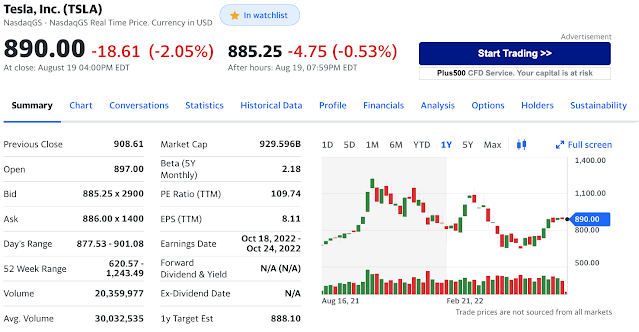
Technical Analysis of Tesla Stock Note that I recommend a fundamental analysis of any company before we consider using the technicals to guide our entries.  While I am bullish about Tesla's fundamentals, here is my outlook for the coming days. Summary of Tesla as of 21 Aug 2022 From the info, we can establish the following: Tesla looks to be ranging around $900 region in the last few days. Tesla is away from the 52-week low of 620.57 & high of 1243.49. The average trading volume of Tesla was 30.03M 1D Chart of Tesla as of 21Aug22 From the above setup, here are my observations: Stochastic has started a downtrend MACD's downtrend was confirmed by the crossover after Friday (19Aug22).   The volume of Tesla for the last week starting from Monday (15 Aug 22) was 29.79M, 29.38M, 22.92M, 15.83M & 20.42M.  The trading volume of each day was under the average of 30.03M .  This reveals the loss of "strength/momentum of the trend". My 3 EMA lines are starting to me...

Example of Trading using Technical (MACD) - with Tesla as example

Image
If we plan to take up positions for a stock using technicals.  How should I do it?  Now, let us look at a simple example using the MACD indicator with Tesla $TSLA as an example. This is done assuming that you have done your due diligence to qualify the company using fundamental analysis and are aware of the Macro developments .   For those of you who are doing Dollar Cost Averaging (DCA), please continue and do not stop. 1D chart of Tesla as of 2226hrs, 09Aug2022 Looking at the 1D chart, the last decline of Tesla took about 32 days (ie 1.5 months) and the climb took about 51 days (ie 2.5 months) using 1D MACD.  Should there be a cross-over of the overbought region for the MACD 1D chart , Tesla should start a downward trend. During this downtrend, there would be some days of up and some days of down   but the magnitude of the drop is much more than that of rising .  As of now, the MACD is yet to cross over. Stochastic has started a downtrend but ...