Posts

Showing posts with the label market corrections

10 Things You Should Know About Bear Markets (Hartford Funds)
Image
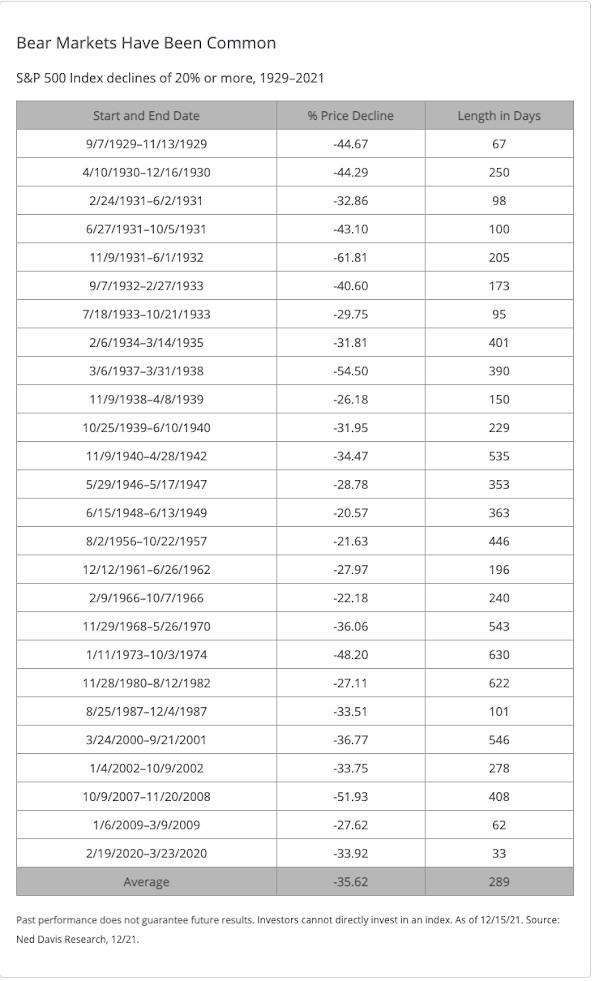
I have stumbled upon this great article "10 things you should know about bear markets". Source of the article: https://www.hartfordfunds.com/practice-management/client-conversations/bear-markets.html Excellent observations about the market by Hartford Funds.  Watch for 20% : Market cycles are measured from peak to trough, so a stock index officially reaches bear territory when the closing price drops at least 20% from its most recent high (whereas a correction is a drop of 10%-19.9%). A new bull market begins when the closing price gains 20% from its low. Stocks lose 36% on average in a bear market . By contrast, stocks gain 114% on average during a bull market . Bear markets are normal. There have been 26 bear markets in the S&P 500 Index since 1928. However, there have also been 27 bull markets—and stocks have risen significantly over the long term. Bear markets tend to be short-lived . The average length of a bear market is 289 days, or about 9.6 months. That’s signi...

My investing muse - How should we invest during market corrections or crashes (04Nov2021)

Image
  Market dips or corrections are part of the journey of investing. Peter Lynch shared that in 93 years, the market saw about 50 market corrections (or dips that are more than 10%) and out of these 50 corrections, 15 of them will be more than 25% in drop.  Thus, this implies that in an average of every 2 years, we should experience a market correction of more than 10% and every 6 years, a crash of more than 25%. From another source,  a  correction  is generally agreed to be a  10% to 20% drop in value  from a recent peak. This can happen to a single company or market as a whole. A  market crash  is usually a  more than a 20% drop in value in the market . The chart above shows an important element - the market always recovers after such corrections (listed by the various corrections from 2009 to 2018). As per 4th Nov 2021 (GMT+8hrs), S&P500 stands at 4660 is way beyond the 2800+ seen on the chart ending Q4/2018. From the chart abo...