Posts

Showing posts with the label bottom

Top 10 top & worst performing stocks based on Q1/2023 earnings (17May2023)

Image
  I have asked Google Bard AI to list the top and worst-performing stocks from the recent Q1/2023 earnings. For this, I have explicitly asked to look into the following criteria: Quarterly revenue growth Net income growth Free Cash Flow (FCF) growth Low Debt to equity ratio Good retained earnings Definition of Retained Earnings provided by Investopedia The above are the data points that I use as a quick filter of stocks addressing my own requirements of revenue growth & profit growth, good cash flow, low debt and good retained earnings. Based on my requirements, Google Bard has recommended the following as top stocks namely, Nvidia, Meta, Tesla, Warner Bros Discovery, Coinbase, Roblox, Roku, PayPal, Alphabet and Microsoft. I have qualified Tesla, Alphabet and Microsoft for long-term holding prior to this exercise. However, I would not touch Coinbase, Roku, Coinbase and Roblox due to my limited circle of competency. For the worst-performing stocks, they are First Republic Bank, ...
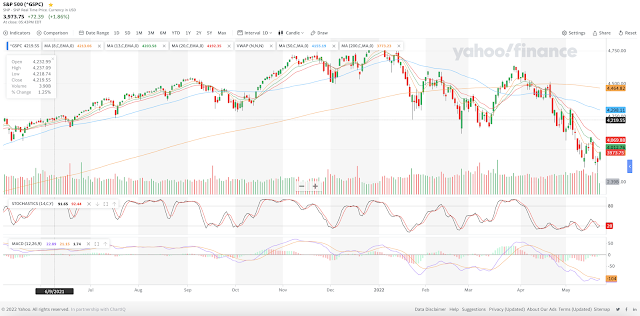
S&P 500 - have we passed the bottom? what can we see from the technicals?

Image
S&P ended the trading day of 24 May 2022 with a +1.86% to close at 3,973.75.  It was up from the recent low of 3,900. 1D chart of S&P500 Using the technical indicators, there are signs of possible reversal but both stochastic and MACD indicators have yet to confirm a reversal as we seek a clear cross over at the bottom .  Looking at the volume, 24 May 2022 closed with a much lower volume of 2.38B compared to the average of 4.18B daily volume.  Though there was much lower trading volume with most buying, this led to the rally of 72 points. Despite the rally, the lack of volume implies that the strength of this may not be "strong".  Volume indicates the "strength" of the trend. Technical analysis of S&P500 1D chart From the technical analysis, the moving averages (both simple and exponential) show a short term "buy" but overall, 9 out of 12 moving averages (75%) still indicate a "sell" market.  Looking at the other technical indicators,...