Posts

Showing posts with the label Technical indicators

Technical analysis of Tesla 1D chart (21Aug22) - has Tesla peaked for now?
Image
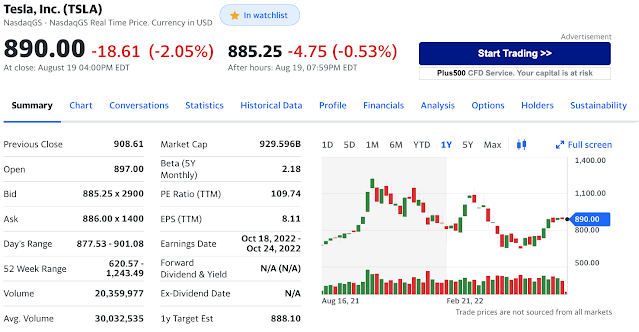
Technical Analysis of Tesla Stock Note that I recommend a fundamental analysis of any company before we consider using the technicals to guide our entries.  While I am bullish about Tesla's fundamentals, here is my outlook for the coming days. Summary of Tesla as of 21 Aug 2022 From the info, we can establish the following: Tesla looks to be ranging around $900 region in the last few days. Tesla is away from the 52-week low of 620.57 & high of 1243.49. The average trading volume of Tesla was 30.03M 1D Chart of Tesla as of 21Aug22 From the above setup, here are my observations: Stochastic has started a downtrend MACD's downtrend was confirmed by the crossover after Friday (19Aug22).   The volume of Tesla for the last week starting from Monday (15 Aug 22) was 29.79M, 29.38M, 22.92M, 15.83M & 20.42M.  The trading volume of each day was under the average of 30.03M .  This reveals the loss of "strength/momentum of the trend". My 3 EMA lines are starting to me...

What is a good price to enter? let technicals guide us instead of the price

Image
Over time, I have often received the question asking what is a good entry price .  After trading for a while, I have found out that it could be better to follow technicals more than some "target" prices (estimated resistance or support levels). First, resistance and support levels are not a singular price point.   Usually, the resistance or support is a zone (a range of prices), not so much a "specific" price.    As most of us know, "trend is our friend" and thus, we are recommended to trade with the ongoing trend.  To understand this better, let us look at Microsoft $MSFT using the 1D chart as an example: Looking at the 1D chart above, we can see that the price is on a decline.  From Stochastic and MACD indicators, we can see that it is on a downtrend .   Other moving averages (MA) technical references above are based on simple and exponential MA.  From the MA technicals above, this points to a likely sell trend...

S&P 500 - have we passed the bottom? what can we see from the technicals?

Image
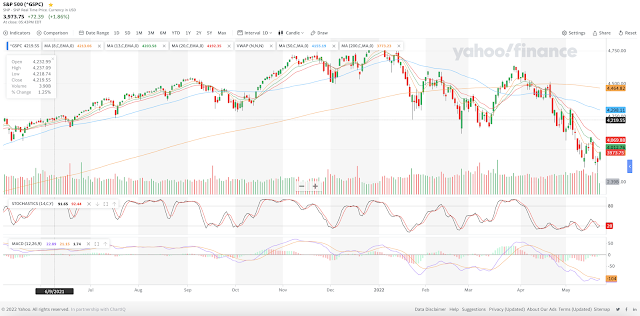
S&P ended the trading day of 24 May 2022 with a +1.86% to close at 3,973.75.  It was up from the recent low of 3,900. 1D chart of S&P500 Using the technical indicators, there are signs of possible reversal but both stochastic and MACD indicators have yet to confirm a reversal as we seek a clear cross over at the bottom .  Looking at the volume, 24 May 2022 closed with a much lower volume of 2.38B compared to the average of 4.18B daily volume.  Though there was much lower trading volume with most buying, this led to the rally of 72 points. Despite the rally, the lack of volume implies that the strength of this may not be "strong".  Volume indicates the "strength" of the trend. Technical analysis of S&P500 1D chart From the technical analysis, the moving averages (both simple and exponential) show a short term "buy" but overall, 9 out of 12 moving averages (75%) still indicate a "sell" market.  Looking at the other technical indicators,...

Technical Analysis of selected stocks (1D chart) - Sea, ICBC, Coupang, TSM & Tesla (as of 15May2022)

Image
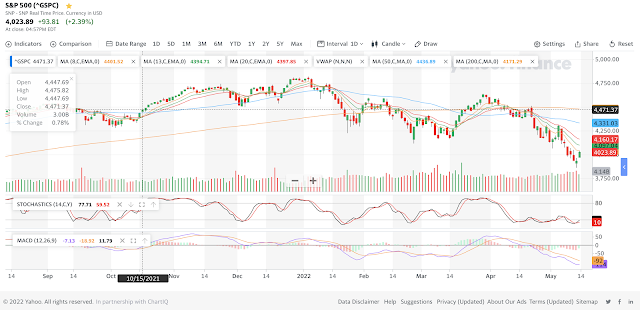
Before I start, let us not forget that we will need to qualify the business first through reviews of its fundamentals over a good period of time.  Its recovery from the ongoing pandemic can give us assurance on the quality of the businesses and the durable competitive advantages that it owns.  Let me look at the macro market as this will affect the technicals. S&P 500 1D chart as of 14 May 2022 In mid-March 2022, we identified a  death cross  (intersection of the Moving Average 50 & 200 lines where the MA 50 cuts MA 200 from above, a usually bearish indicator) using the 1D chart. From the technical indicators, the 1D chart of S&P 500 looks to be hitting the bottom soon.  The Stochastic seems to have bottomed up and a reversal seems to be in place.  The MACD indicator shows that the decline has yet to bottom up and there could be more room to go down.  Till the reversal in MACD is completed, I prefer prudence and assume the decline could con...

Technical Analysis (with EMA) - TSLA, MSFT & BABA

Image
Before I start, let us not forget that we will need to qualify the business first through reviews of its fundamentals over a good period of time.  Its recovery from the ongoing pandemic can give us assurance on the quality of the businesses and the durable competitive advantages that it owns.  What I am doing now is the technical setup that helps me to take a position for trade or when a great company reaches a range of "discounted" prices.  This is also known as the margin of safety that value investors add. Personally, I prefer investing over trading that it essentially has a much longer-term time horizon - over 10 years into perpetuity.  Trading requires much more effort & closer monitoring.  The timezone difference does not permit me to trade actively when I live 12 hours away from the US market.  For the coming examples, I am exploring trading and not investing. Coming to trades, we need to consider market sentiment as that can drive the prices in...

technical analysis exercise 1D Chart 12Apr22 for PLTR, SE & INTC

Image
Technical Analysis Exercise (12Apr2022) This is looking at charts based on technical analysis of their 1D chart.  It is strongly recommended to conduct fundamental analysis before we conduct any technical analysis . Abbreviation  (based on 1D chart) MA = Moving Average MA50 = Moving Average 50 days (short term trend) MA200 = Moving Average 200 days (longer-term trend) Being prudent, I will give preference MACD indicator for the following logic:  I will rather be late than too early.  I may get lesser profits but I could (potentially) avoid a bigger loss (entering too early and catching a falling knife).   One of the factors influencing my decision will be the Beta of the stock (above 1 being more volatile).  If the stock is more volatile, I may consider leaning more on stochastic than MACD.  As per my previous article, MACD is giving a much more reliable signal than Stochastic . PLTR 1D chart as of 12Apr22 2320hrs Avg. Volume is 52,748,511 ...

Technical indicators comparison - Stochastic versus MACD

Image
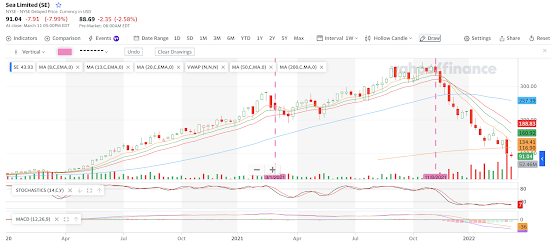
My investment approach is mostly long term assets where I hope that I can hold on to them for years or decades.  Today, I will compare 2 common indicators - stochastic and MACD. Steps to investing I will usually start with a financial analysis of the company (over several years) to qualify a company . After which, I will look for an entry point (with a margin of safety) where I will deploy my technical setup for entry.  For trends, I would be looking at either 1 Day chart or 1 Week chart for a start.   For $SE, I could not "invest" in the company as its financial fundamentals are not convincing.  I maintain that the performance of the business must make it a "no brainer" for me to invest.  Given that the gaming market has 3 billion users, this company remains an area of interest.  On top of gaming, $SE has also ventured into e-commerce and fintech which could increase their total addressable market (TAM) significantly.     1W cha...