Technical Analysis of selected stocks (1D chart) - Sea, ICBC, Coupang, TSM & Tesla (as of 15May2022)
Before I start, let us not forget that we will need to qualify the business first through reviews of its fundamentals over a good period of time. Its recovery from the ongoing pandemic can give us assurance on the quality of the businesses and the durable competitive advantages that it owns.
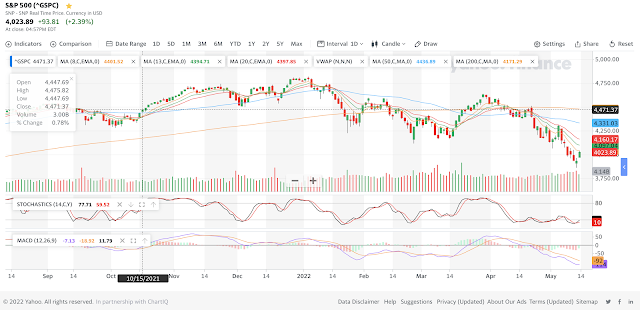
Let me look at the macro market as this will affect the technicals.
 | |
|
TECHNICAL ANALYSIS (USING 1D CHARTS) AS OF 15May2022
 |
| 1Dchart for Sea Limited as of 15May2022 |
Sea Limited observations:
- A Death Cross was seen in early Jan 2022 and the stock has been in decline since Oct 2021.
- From the EMA, the lines seem to be moving sideways. Once they converge, the reversal is likely confirmed.
- Stochastic - has bottomed up and it is on an upward trend.
- MACD - looks to be bottoming up soon and with its completion, we can consider a potential reversal of the current trend to an upward trend. Do give the stock a couple of days to confirm the reversal. If you wish to be more prudent, I suggest that we look at the 1W chart's MACD instead.
 |
| 1D chart of TSM as of 15May2022 |
- A Death Cross was seen after mid-March 2022 and the stock has been in decline since Jan 2022.
- From the EMA, the lines seem to be moving sideways. Once they converge, the reversal is likely confirmed.
- Stochastic - has bottomed up and it is on an upward trend.
- MACD - looks to be bottoming up soon and with its completion, we can consider a potential reversal of the current trend to an upward trend. Do give the stock a couple of days to confirm the reversal.
 |
| 1D chart of Coupang as of 15May2022 |
Coupang observations:
- A Death Cross was seen after Apr 2022 and the stock has been in decline since Dec 2021 though the March 2022 rally failed to break the downtrend.
- From the EMA, the lines seem to be moving sideways. Once they converge, I will this as a confirmation of the reversal of its current downtrend.
- Stochastic - has bottomed up and it is on an upward trend.
- MACD - has bottomed up and this is likely a reversal of the current trend to an upward trend.
 |
| 1D chart of ICBC / 1398.HK as of 15May2022 |
ICBC / 1398.HK observations:
- A Golden Cross was seen in Feb 2022 and the stock has been in decline since Apr 2022.
- From the EMA, the lines seem to be moving sideways. Once they converge, the reversal is likely confirmed.
- Stochastic - should bottom-up by the coming week.
- MACD - still on down trend though it seems to be going sideways - potential for reversal. Once the MACD lines have intersected, we can consider a potential reversal of the current trend to an upward trend. Do give the stock a couple of days to confirm the reversal. If you wish to be more prudent, I suggest that we look at the 1W chart's MACD instead.
 |
| 1D chart of Tesla as of 15May2022 |
Tesla observations:
- A Death Cross may form pending the coming few days stock movement.
- Stochastic - has bottomed up and it is on an upward trend.
- MACD - looks to be bottoming up soon and with its completion, we can consider a potential reversal of the current trend to an upward trend. Do give the stock a couple of days to confirm the reversal. If you wish to be more prudent, I suggest that we look at the 1W chart's MACD instead.


Comments
Post a Comment