Posts

Showing posts from March, 2022

BABA ownership updates as of 30Mar2022 - why is there more institutional buying?

Image
JP Morgan called China investable as per the 15Mar2022 news article.  Here is an extract from the news article : Chinese tech stock rout deepened, slashing billions of dollars from the likes of Alibaba Group Holding and Tencent Holdings in Hong Kong, on heightened concerns about an industry crackdown, Covid-19 outbreaks, and China's position on the Ukraine conflict. Losses spiralled after JPMorgan Chase downgraded 28 Chinese internet stocks including Alibaba, Tencent Holdings and Meituan to underweight, calling them "uninvestable" over the next six to 12 months due to rising geopolitical and macro risks, Bloomberg reported. $BABA released ownership updates as of 30 Mar 2022.  There seems to be much more institutional buying than selling as per the details below . Activity for 30Mar22 of holders (more than 0.5% change in shares outstanding) Some notable additions in Q1/2022: The Vanguard Group added 28.6M shares, totalling 469.9M shares as of 28Feb22 BlackRock Fund Adviso

Inverted Yield Curve looks to be forming ... ... what should we do?

Image
There is much talk about yield curve inversions and their correlation with recessions. the news painted a mixed response to the inverted yield curve Yield curve extracted from Reuters From Investopedia: An inverted yield curve describes the unusual drop of yields on longer-term debt below yields on the short-term debt of the same credit quality.   Sometimes referred to as a negative yield curve, the inverted curve has proven in the past to be a relatively reliable lead indicator of a recession. The yield curve can be expressed using a percentage of the 2-year and 10-year treasury yield rates or the net difference between the 2 year and 10 years treasure rates.  From marketwatch.com - note that a recession usually follows the inversion An inversion in these particular points has correctly predicted a recession with a lead time of between eight months and two years in each of the last eight recessions .   The average time between the formation of the inverted yield curve and the subseque

$SE SEA Limited stock FY2021 financial analysis (29Mar2022)

Image
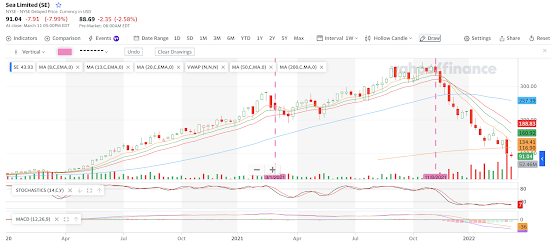
$SE stock fell from a recent high of $372.70 to $116.98 as of 28Mar2022 US market close.  This is a drop of over 68.6% . Has the stock reached a bottom or will the decline continue?    Extract from Motley Fool's  article about $SE (dated 28Mar2022): "The e-commerce gross orders were up by 90% year over year. Ninety percent, that's pretty stellar growth. SeaMoney total payment volume was up 70% year over year to $5 billion. Which is about 1/9th of what Block ( SQ 5.98% ) does in terms of volume. About 1% or 2% of what PayPal ( PYPL 2.12% ) does. This is a very small amount of payment volume so far, so they can keep that 70% growth rate up for several years to come. Gross profit up 146% year over year, which shows that the business is starting to become a little more efficient. They're still losing money because they are investing so much in their growth which is fine with those numbers. Over $10 billion of cash on the balance sheet to absorb any short-term losses they

An interesting company to watch out for UiPATH $PATH

Image
  Interesting company to watch out for - $PATH $PATH 1D chart as per 27 Mar 2022 Another company of interest is UiPath $PATH which was recently recognised as a leader in the IDC (market intelligence).  From the 1D chart, the company hit a high of $90 and has since been on a decline.  From the MACD & Stochastic, the downtrend may continue this week though the coming earnings may detract its movement. Here is the news extract dated 23rd March 2022: News article from Yahoo Finance dated 23 Mar 2022 "a leading enterprise automation software company, today announced that it has been named a Leader in the IDC MarketScape: Worldwide Cloud Testing 2022 Vendor Assessment – Empowering Business Velocity.* The report, which includes UiPath for the first time among traditional software quality tools, examines cloud testing adoption trends and their influence on organizational success through the development of secure, high-quality software." Market intelligence is one of the frontiers

Earnings & preview for the week starting 28 Mar 2022

Image
Some of the most anticipated earnings for the week starting 28Mar2022 Earnings for week starting 28 Mar 2022 EV will get some updates from Xpeng and Lucid.  Micron's earnings are interesting with the recent hype about chip makers being key in our digital age.  Thursday will see Blackberry reporting their earnings.   The market remains nervy with dark clouds of the Ukraine crisis, the next waves of Russian sanctions and also China's Covid outbreak ready to spook the market. Interesting company to watch out for - $PATH $PATH 1D chart as per 27 Mar 2022 Another company of interest is UiPath $PATH which was recently recognised as a leader in the IDC (market intelligence).  Here is the news extract dated 23rd March 2022: News article from Yahoo Finance dated 23 Mar 2022 "a leading enterprise automation software company, today announced that it has been named a Leader in the IDC MarketScape: Worldwide Cloud Testing 2022 Vendor Assessment – Empowering Business Velocity.* The repo

10 Things You Should Know About Bear Markets (Hartford Funds)

Image
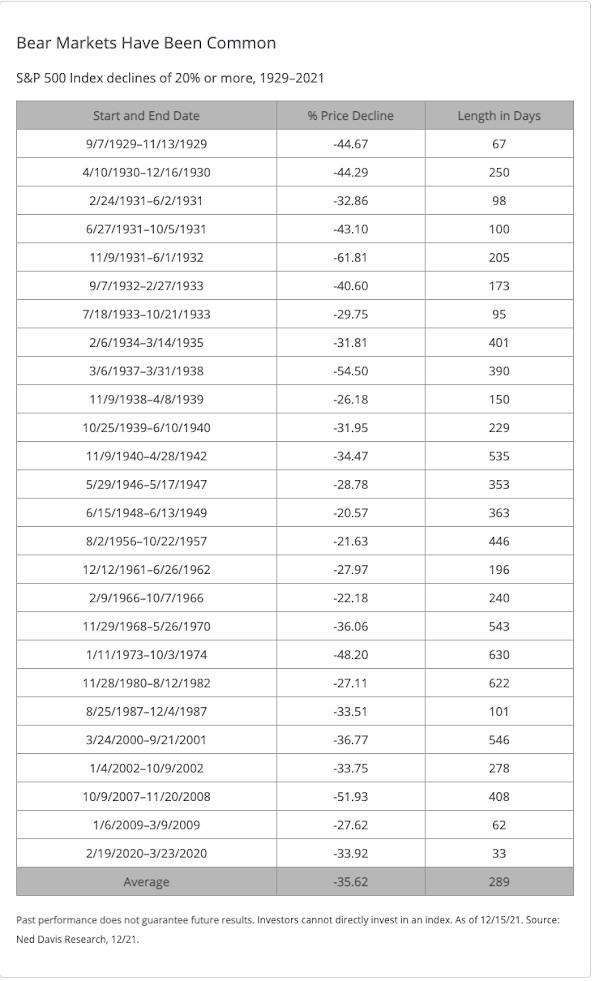
I have stumbled upon this great article "10 things you should know about bear markets". Source of the article: https://www.hartfordfunds.com/practice-management/client-conversations/bear-markets.html Excellent observations about the market by Hartford Funds.  Watch for 20% : Market cycles are measured from peak to trough, so a stock index officially reaches bear territory when the closing price drops at least 20% from its most recent high (whereas a correction is a drop of 10%-19.9%). A new bull market begins when the closing price gains 20% from its low. Stocks lose 36% on average in a bear market . By contrast, stocks gain 114% on average during a bull market . Bear markets are normal. There have been 26 bear markets in the S&P 500 Index since 1928. However, there have also been 27 bull markets—and stocks have risen significantly over the long term. Bear markets tend to be short-lived . The average length of a bear market is 289 days, or about 9.6 months. That’s signi

Technical indicators comparison - Stochastic versus MACD

Image
My investment approach is mostly long term assets where I hope that I can hold on to them for years or decades.  Today, I will compare 2 common indicators - stochastic and MACD. Steps to investing I will usually start with a financial analysis of the company (over several years) to qualify a company . After which, I will look for an entry point (with a margin of safety) where I will deploy my technical setup for entry.  For trends, I would be looking at either 1 Day chart or 1 Week chart for a start.   For $SE, I could not "invest" in the company as its financial fundamentals are not convincing.  I maintain that the performance of the business must make it a "no brainer" for me to invest.  Given that the gaming market has 3 billion users, this company remains an area of interest.  On top of gaming, $SE has also ventured into e-commerce and fintech which could increase their total addressable market (TAM) significantly.     1W chart of $SE Based on the 1W chart ab

Market Leadership happens when your rival mentions you

Image
Market leadership happens when your rival mentions you in their promotion, at their costs and doing the entire EV industry a big favour towards sustainability. When a rival makes claim to challenge the market leader, it affirms the lead, the leadership & their own lag . what's better - the rival pays for the promotion. For the EV industry as a whole, it is good to work towards a sustainable future. As per www.thestreet.com, GM Begins Production of Its Tesla Killer Why does Tesla need to spend on advertisements when their competition does it for them.

NIO 2021Q4 & FY2021 Earnings Report Review

Image
NIO's earnings report was released on 24 Mar 2022.  As one of the premier China EV brands, there is much expectation on its performance. Q4/2021 Earnings Overview EPS: actual -$1.07 versus forecast -$0.8792 <MISS> Revenue: actual $9.9B versus forecast $9.78B <BEAT>  24Mar22 earnings result from investing.com NIO released their results and here is the overview extracted from their report: Vehicle sales were RMB33,169.7 million (US$5,205.1 million) for the full year of 2021, representing an increase of 118.5% from the previous year. Vehicle margin was 20.1% for the full year of 2021, compared with 12.7% for the previous year. Total revenues were RMB36,136.4 million (US$5,670.6 million) for the full year of 2021, representing an increase of 122.3% from the previous year. Gross profit was RMB6,821.4 million (US$1,070.4 million) for the full year of 2021, representing an increase of 264.1% from the previous year. Gross margin was 18.9% for the full year of 2021, compared wit

List of best small cap companies from 2021 - Forbes

Here is the list of best small cap companies from #Forbes for 2021. we have sorted out these by their 52-week return, with the top performers listed on top.   As always, this is a good list for us to start our research with.  Please do our own due diligence before investing. Forbes list of best small cap companies 2021 https://www.forbes.com/lists/best-small-cap-companies/#60bc3ec647db Rank Company Industry 52-Week Return Revenue 1 IDT Telecommunications Services 498% $1.4 B 2 Joint Corp Health Care Equipment & Service 389.10% $70.2 M 3 Big 5 Sporting Goods Retailing 326.50% $1.2 B 4 Gritstone bio Drugs & Biotechnology 321.30% $44.8 M 5 Aviat Networks Technology Hardware & Equipmen