Technical indicators comparison - Stochastic versus MACD
My investment approach is mostly long term assets where I hope that I can hold on to them for years or decades. Today, I will compare 2 common indicators - stochastic and MACD.
Steps to investing
I will usually start with a financial analysis of the company (over several years) to qualify a company. After which, I will look for an entry point (with a margin of safety) where I will deploy my technical setup for entry. For trends, I would be looking at either 1 Day chart or 1 Week chart for a start.
For $SE, I could not "invest" in the company as its financial fundamentals are not convincing. I maintain that the performance of the business must make it a "no brainer" for me to invest. Given that the gaming market has 3 billion users, this company remains an area of interest. On top of gaming, $SE has also ventured into e-commerce and fintech which could increase their total addressable market (TAM) significantly.
 |
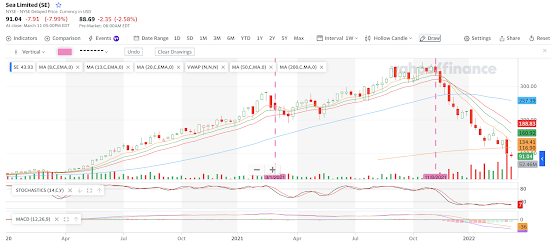
| 1W chart of $SE |
Based on the 1W chart above, $SE is on a downtrend and a bottom has yet to be reached based on MACD. This implies that there is (potentially) more downside to this ticket. If we use the stochastic indicator, the stock is ranging along the bottom. For stochastic, if there is any crossover along the bottom, it would usually be treated as a "Buy" signal for the long position. If we have bought $SE at the first crossover of the stochastic indicator near Dec 2021, it would be too early, causing a loss of over 50% based on today's price.
However, if we look at the MACD indicator, it is clear that the bottom has yet to be reached and thus, the price is likely to drop further. Looking at the 1W chart, the downtrend is clear and there are much lesser noises (or distractions) as compared to the 1D chart. If we are planning to invest for the long term (years or decades), we should be looking at charts with a longer time horizon.
From the 1D chart below, a death cross was spotted in early Jan 2022, a typically bearish signal.
 |
| 1D chart of $SE show Death Cross (a typically bearish signal) in 2022 |
- As per the 1D ^GSPC chart (S&P500), the MACD indicator is definitely less noisy compared to the Stochastic indicator.
- Before we start to trade using these technical indicators, let us start by doing some backtesting first. First, this will give a good sense of the "win rate" for us to establish a "reasonable returns" expectation.
- The more we sample, the more accurate will be our finding.
- There is no such thing as "The Perfect Setup" as there are many variable factors.
- I assume that I make mistakes and thus, I review my strategies regularly.
- There are black swan events like the Ukraine war and subsequent Russian sanctions that would affect the market at a macro level.
- When black swans appear, the whole market suffers. Our technical and fundamental analysis was overruled by the " overwhelming market sentiments".
- I prefer a chart with minimal indicators.
- My current setup consists of slow stochastic, MACD and moving averages.
- A technical approach backed by fundamental analysis to qualify the company will be a good place to start.


Comments
Post a Comment