Preview of the week starting 23May2022
Holidays
Nil for Singapore, Hong Kong, China & USA
News Summary for the week ending 22 May 2022
Fish and chips are among the most common dishes in the UK, which is deeply dependent on imports from Ukraine and Russia. According to NFFF officials, around 40% of the industry's cod and haddock come from Russia, and 50% of its sunfloweroil is from Ukraine.
The UN warns that 49 million people across 43 nations are facing emergency levels of hunger. The UN Secretary-General says the crisis in Ukraine will have lasting implications around the world.
 |
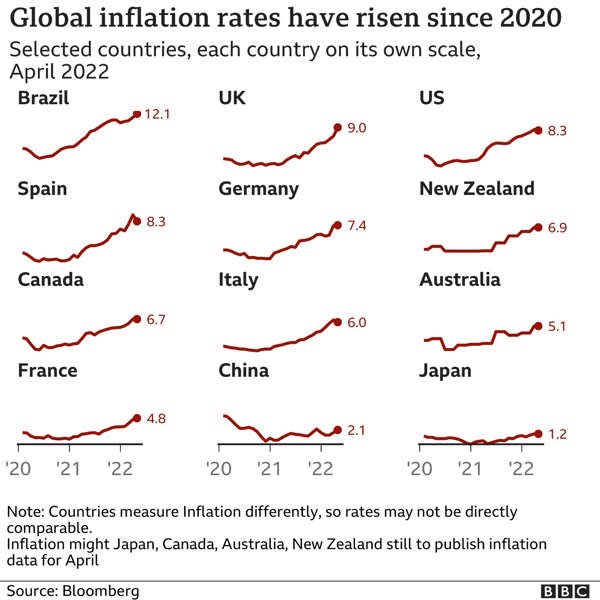
| Inflation of global economies since 2020 |
From the charts above, most major economies are fighting inflation since 2020. Only China is seeing a downward trend for inflation. China continues to record a net inflow of cross-border capital in April 2022.
Recession taunts the market as earnings disappoint. It may not be a taunting as we could well be part of the recession.
Mr Powell signalled on Tuesday that the central bank was likely to follow a 0.5% raise earlier this month, to a range between 0.75% & 1%, with similar moves at meetings in June and July. Until this month, the Fed hadn't raised rates in such intervals since 2000.
Elon has called out a 12 to 18 months long recession as reported by Bloomberg. I am aligned with that. What is the first asset class that will give way significantly? Will it be crypto, real estate, stocks, bonds or others?
Economic Calendar
 |
| Economic Calendar for the week ending 20 May 2022 |
From the above, we see more jobless claims (from the previous 197K to 218K). The increase in the drawdown of the crude oil inventories does imply more bullish consumption expected in the coming weeks. Crude oil will require time to be processed before products can be consumed.
 |
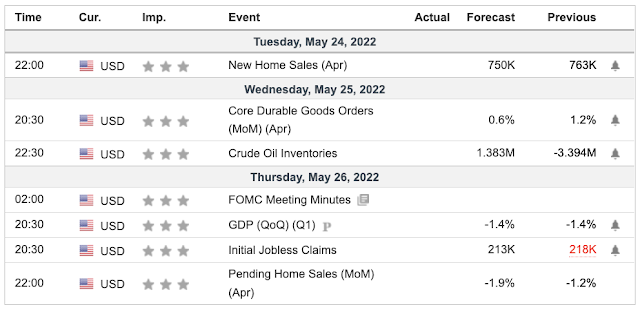
| Economic Calendar for the week starting 23 May 2022 |
We will be getting the GDP figures and initial jobless claims updates. Both will be key for the Fed Reserve to fine-tune strategies to bring both inflation and unemployment under control.
Buffett Indicator as of 20 May 2022
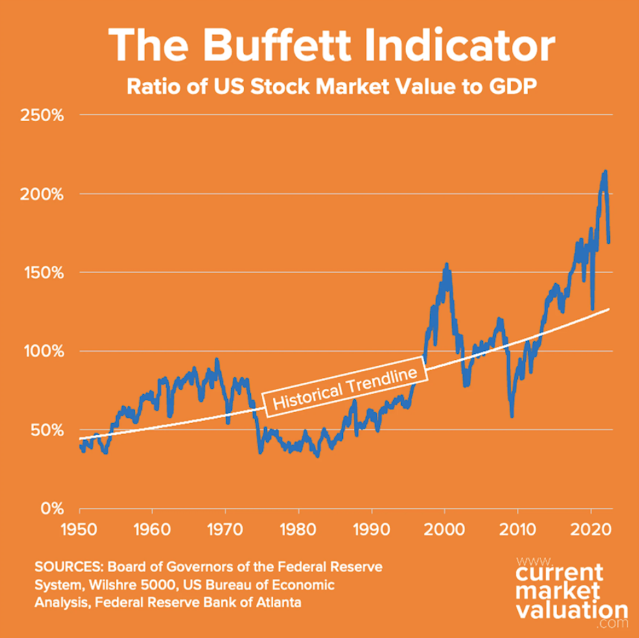
The Buffett Indicator is the ratio of total United States stock market valuation to GDP. As of May 20, 2022 we calculate the Buffett Indicator as:
Aggregate US Market Value: $41.7T
Annualized GDP: $24.7T
Buffett Indicator: $41.7T ÷ $24.7T = 169%
Aggregate US Market Value: $41.7T
Annualized GDP: $24.7T
Buffett Indicator: $41.7T ÷ $24.7T = 169%
 |
| Buffett Indicator from currentmarketvaluation.com as of 13May22 |
By our calculation that is currently 29% (or about 0.9 standard deviations) above the historical average, suggesting that the market is Fairly Valued. We are coming off historical highs for this indicator.
While we wait for Q2/2022 GDP results due in Q3, another decline will confirm that the market is in a technical recession. From the recent earnings and situations, we are already in a recession.
While there are several ones who called out that the downtrend has reached a bottom. It would be prudent to be observing more. It is not over till the fat lady sings and we have yet to see the single "collapse" event or subsequent rippling effects.
While there are several ones who called out that the downtrend has reached a bottom. It would be prudent to be observing more. It is not over till the fat lady sings and we have yet to see the single "collapse" event or subsequent rippling effects.
I do not wish that my "forecast" to be true but I think that we need to be prudent to watch the market accordingly. It is good to be an observer for now.
There are some interesting earnings releases for the coming week:
XPENG
Guangzhou Xiaopeng Motors Technology Co Ltd, doing business as XPeng Motors, commonly known as XPeng, is a Chinese electric vehicle manufacturer. The company is headquartered in Guangzhou, with offices in Mountain View, California, United States and is publicly traded on the New York Stock Exchange. As of May 2021, 23% of XPeng shares are owned by He Xiaopeng, and 12% by Alibaba Group.
ZOOM
Zoom Video Communications, Inc. is an American communications technology company headquartered in San Jose, California. It was one of those who "benefitted" from the pandemic when we worked from home.
NVIDIA
Nvidia designs and sells GPUs for gaming, cryptocurrency mining, and professional applications, as well as chip systems for use in vehicles, robotics, and other tools. 1 Some of the company's biggest competitors include Intel Corp.
Costco
Costco Wholesale Corporation is an American multinational corporation which operates a chain of membership-only big-box retail stores. As of 2020, Costco was the fifth largest retailer in the world, and the world's largest retailer of choice and prime beef, organic foods, rotisserie chicken, and wine as of 2016.
Alibaba
Alibaba Group Holding Limited, also known as Alibaba, is a Chinese multinational technology company specializing in e-commerce, retail, Internet, and technology. ALIBABA GROUP’S MISSION IS TO MAKE IT EASY TO DO BUSINESS ANYWHERE.
Baidu
Baidu, Inc. is a Chinese multinational technology company specializing in Internet-related services and products and artificial intelligence, headquartered in Beijing's Haidian District. It is one of the largest AI and Internet companies in the world.
Personally, I am looking forward to the above companies with an acute interest in $BABA.
Market Outlook for the coming week
 |
| Fear & Greed Index overview as of 22 May 2022 |
 |
| Fear & Greed Index timeline as of 22 May 2022 |
The Fear & Greed Index is a way to gauge stock market movements and whether stocks are fairly priced. The theory is based on the logic that excessive fear tends to drive down share prices, and too much greed tends to have the opposite effect.
The Fear & Greed Index is a compilation of seven different indicators that measure some aspects of stock market behavior. They are market momentum, stock price strength, stock price breadth, put and call options, junk bond demand, market volatility, and safe haven demand. The index tracks how much these individual indicators deviate from their averages compared to how much they normally diverge. The index gives each indicator equal weighting in calculating a score from 0 to 100, with 100 representing maximum greediness and 0 signalling maximum fear.
From the Fear & Greed index, the sentiment of "extreme fear" remains in the market. This is likely to continue in the coming week. Hopefully, we can find some relief in some good news and earnings.
 |
| 1D chart of S&P 500 as of 22 May 2022 |
From the chart above, it is likely the market's decline to continue. This can drag out if this week's economic and earnings reports fail to uplift the market. While some are calling out for the drop to bottom soon, I am looking hard for reasons for the reversal. The Ukraine war drags on, Covid is seeing some resurgence in some places but it was not as worrisome as seen in the number of hospitalization cases. Inflation and unemployment data are proving to be tricky as the Federal Reserve walk the tightrope suspended between inflation and recession.
For now, I recommend prudence and setting aside "cash for crash".


Comments
Post a Comment