Buffett Indicator and recession
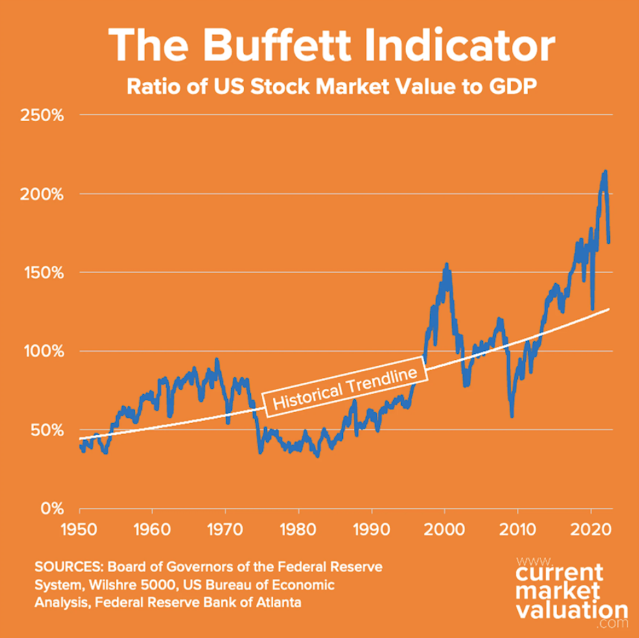
Buffett Indicator as of 20 May 2022.
The Buffett Indicator is the ratio of total United States stock market valuation to GDP. As of May 20, 2022 we calculate the Buffett Indicator as:
Aggregate US Market Value: $41.7T
Annualized GDP: $24.7T
Buffett Indicator: $41.7T ÷ $24.7T = 169%
 |
| Buffett Indicator from currentmarketvaluation.com as of 13May22 |
By our calculation that is currently 29% (or about 0.9 standard deviations) above the historical average, suggesting that the market is Fairly Valued. We are coming off historical highs for this indicator.
While we wait for Q2/2022 GDP results due in Q3, another decline will confirm that the market is in a technical recession. From the recent earnings and situations, we are already in a recession.
While there are several ones who called out that the downtrend has reached a bottom. It would be prudent to be observing more. It is not over till the fat lady sings and we have yet to see the single "collapse" event or subsequent rippling effects.
I do not wish that my "forecast" to be true but I think that we need to be prudent to watch the market accordingly. It is good to be an observer for now.


Comments
Post a Comment