What are the trends of S&P500 EPS & P/E Ratios? (04May2023)
S&P 500 Earnings Per Share (I:SP500EPS)
39.61 USD for Q4 2022
The following data are extracted from Ychart
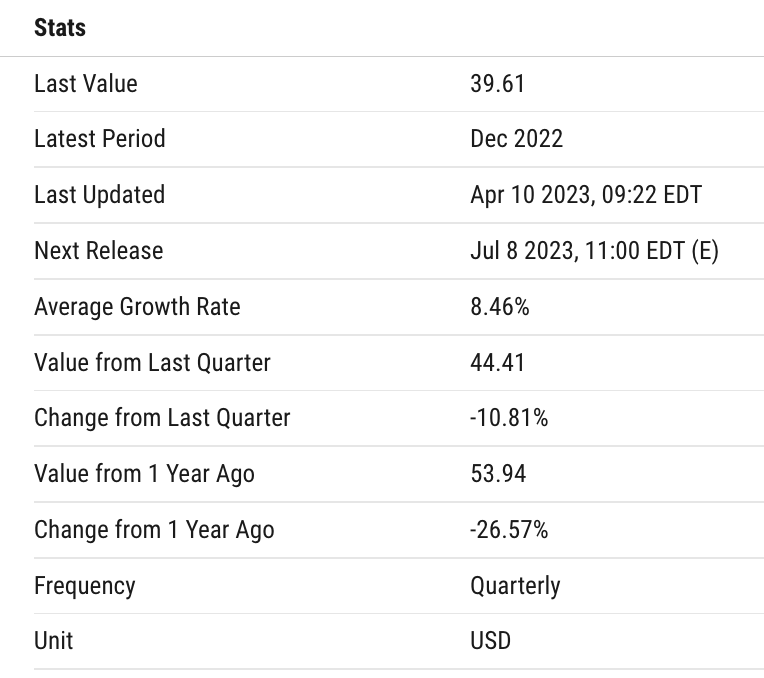
S&P 500 Earnings Per Share is at a current level of 39.61, down from 44.41 last quarter and down from 53.94 one year ago. This is a change of -10.81% from last quarter and -26.57% from one year ago.
The S&P 500 Earnings Per Share measures the composite earnings per share for the S&P 500. This metric comes from Standard & Poors, and gives an idea of the overall EPS earned from the major US companies. EPS numbers experienced tumultous times during the financial crisis in 2008. S&P 500 EPS reached as low as -23.25, when many companies were not able to return a profit.
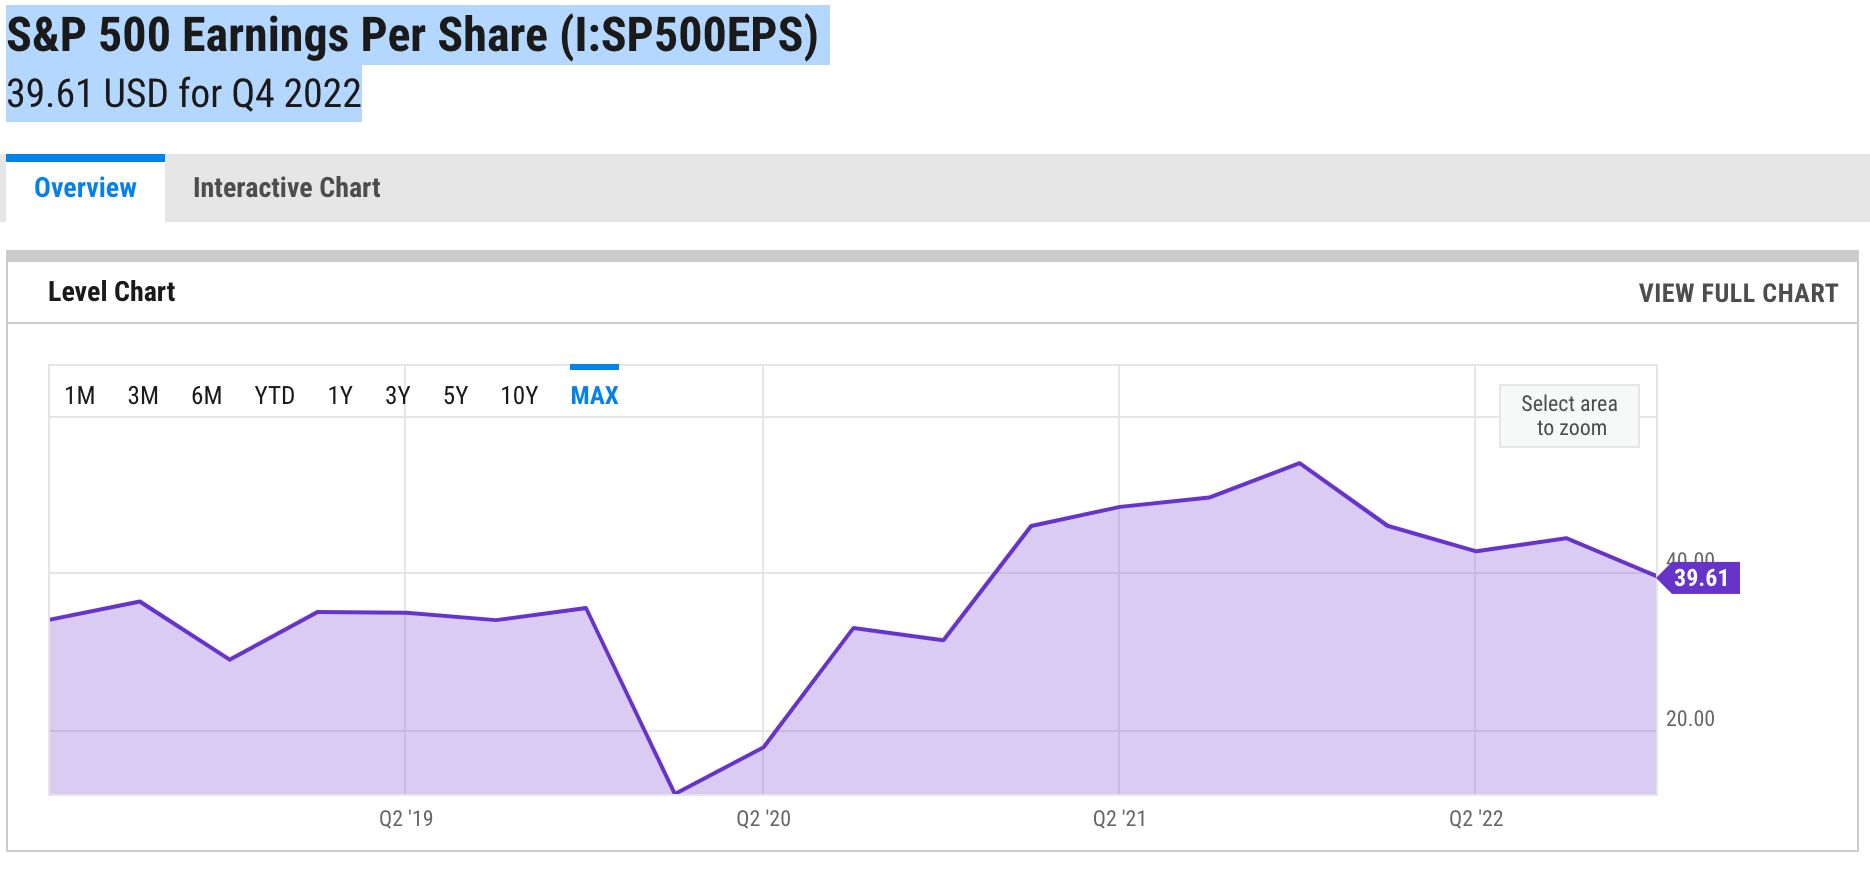
From the chart above, Q4/2022 sees S&P500 Earnings Per Share (I:SP500EPS) stand at USD39.61.
Since the recent peak of Q4/2021, there is a general downtrend for 2022. This implies that the S&P500 companies are seeing a downward trend in earnings per share (EPS).
From the above, we have the following observations:
- Q3/2022 is 44.41
- The drop in EPS from Q3/2022 to Q4/2022 is 10.81%
- The drop in EPS from 1 year ago to Q4/2022 is 26.57%
As the Q1/2023 earnings season is still ongoing, hopefully, we can see improvements in the EPS to break this downward trend.
S&P500 P/E Ratio (I:SP500PER)
22.23 for Q4 2022
The following data are extracted from Ychart
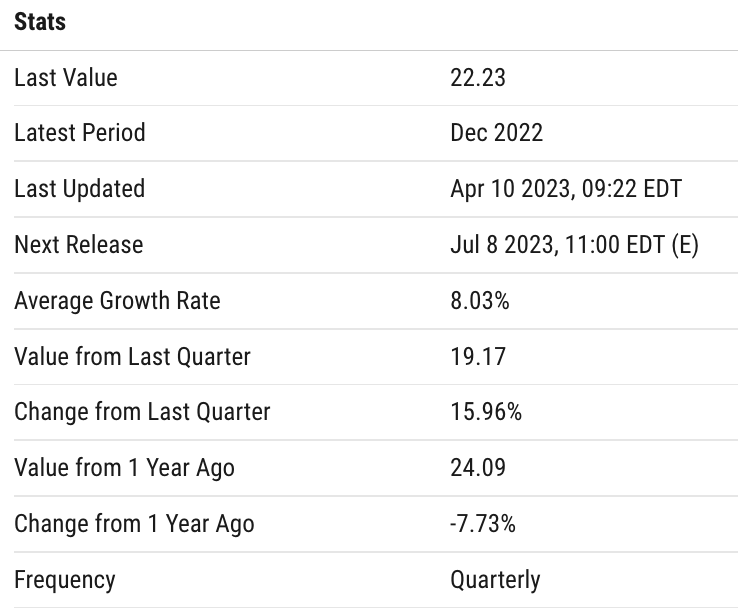
S&P 500 P/E Ratio is at a current level of 22.23, up from 19.17 last quarter and down from 24.09 one year ago. This is a change of 15.96% from last quarter and -7.73% from one year ago.
The S&P 500 PE Ratio is the price to earnings ratio of the constituents of the S&P 500. The S&P 500 includes the 500 largest companies in the United States and can be viewed as a gauge for how the United States stock market is performing. The price to earnings ratio is a valuation metric that gives a general idea of how a company's stock is priced in comparison to their earnings per share. Historically, the S&P 500 PE Ratio peaked above 120 during the financial crisis in 2009 and was at its lowest in 1988.
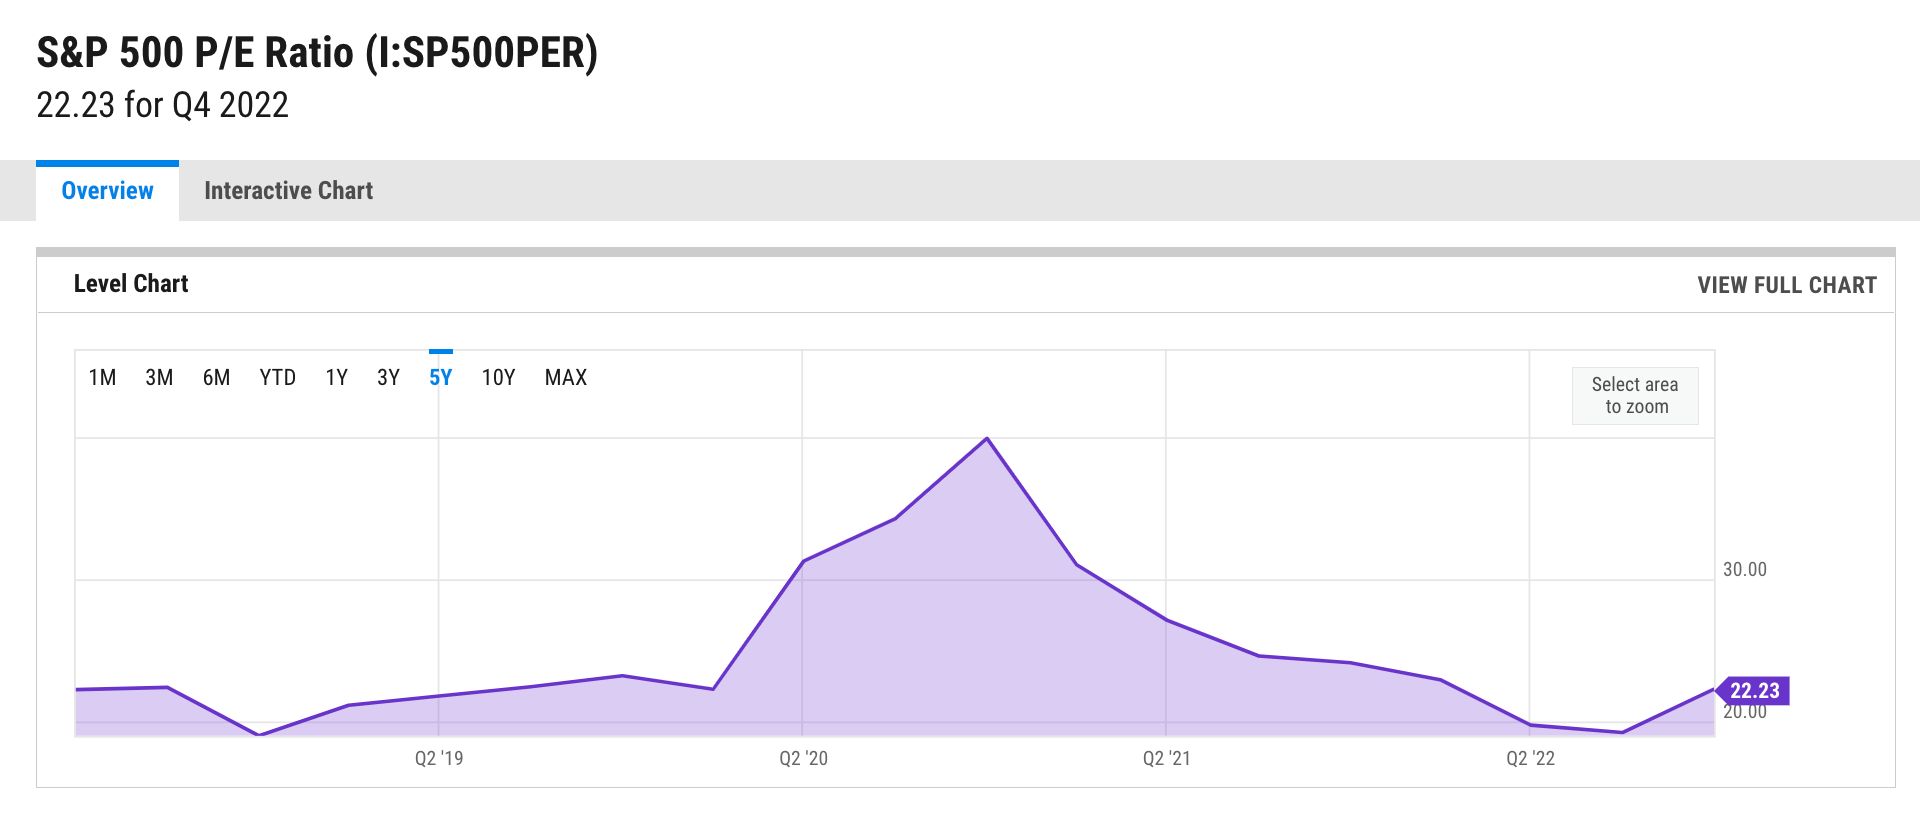
From the chart above, the P/E downtrend is changing to an uptrend. However, an increasing P/E ratio can be interpreted as the stock prices getting more expensive in relation to its earnings (EPS).
From the above, we have the following observations:
- Q3/2022 P/E is 19.17
- There is an increase of P/E from Q3/2022 to Q4/2022 by 15.96% from 19.17
- There is a drop of P/E from a year ago by 7.73% from 24.09
My investing muse
With EPS dropping, the recent increase in PE shows that the growth of the price of stocks is more than the growth of the EPS. In other words, the stock prices are getting more expensive relative to previous quarters. However, it does not mean that all the stocks are too expensive with reference to the fair value.
To be more accurate, we should consider comparing the EPS and P/E of a stock against the industry average and its closest competition. The EPS & P/E should not be the only means to determine “fair” valuation.
Some of the folks look at different valuation models like DCF. Personally, I prefer to use measurements of the current value instead of using projections for the future. The present and past are known but no future is guaranteed. Thus, my preference is to look at the current valuation. Do not forget to apply a margin of safety to our valuation so that we have a healthy buffer.
Let us continue to monitor the market as various analysts have projected an approaching recession. Let us research before we invest.


Comments
Post a Comment