Was Q2FY23 a good earnings for META?
This is an excellent summary provided by Twitter User EconomyApp:
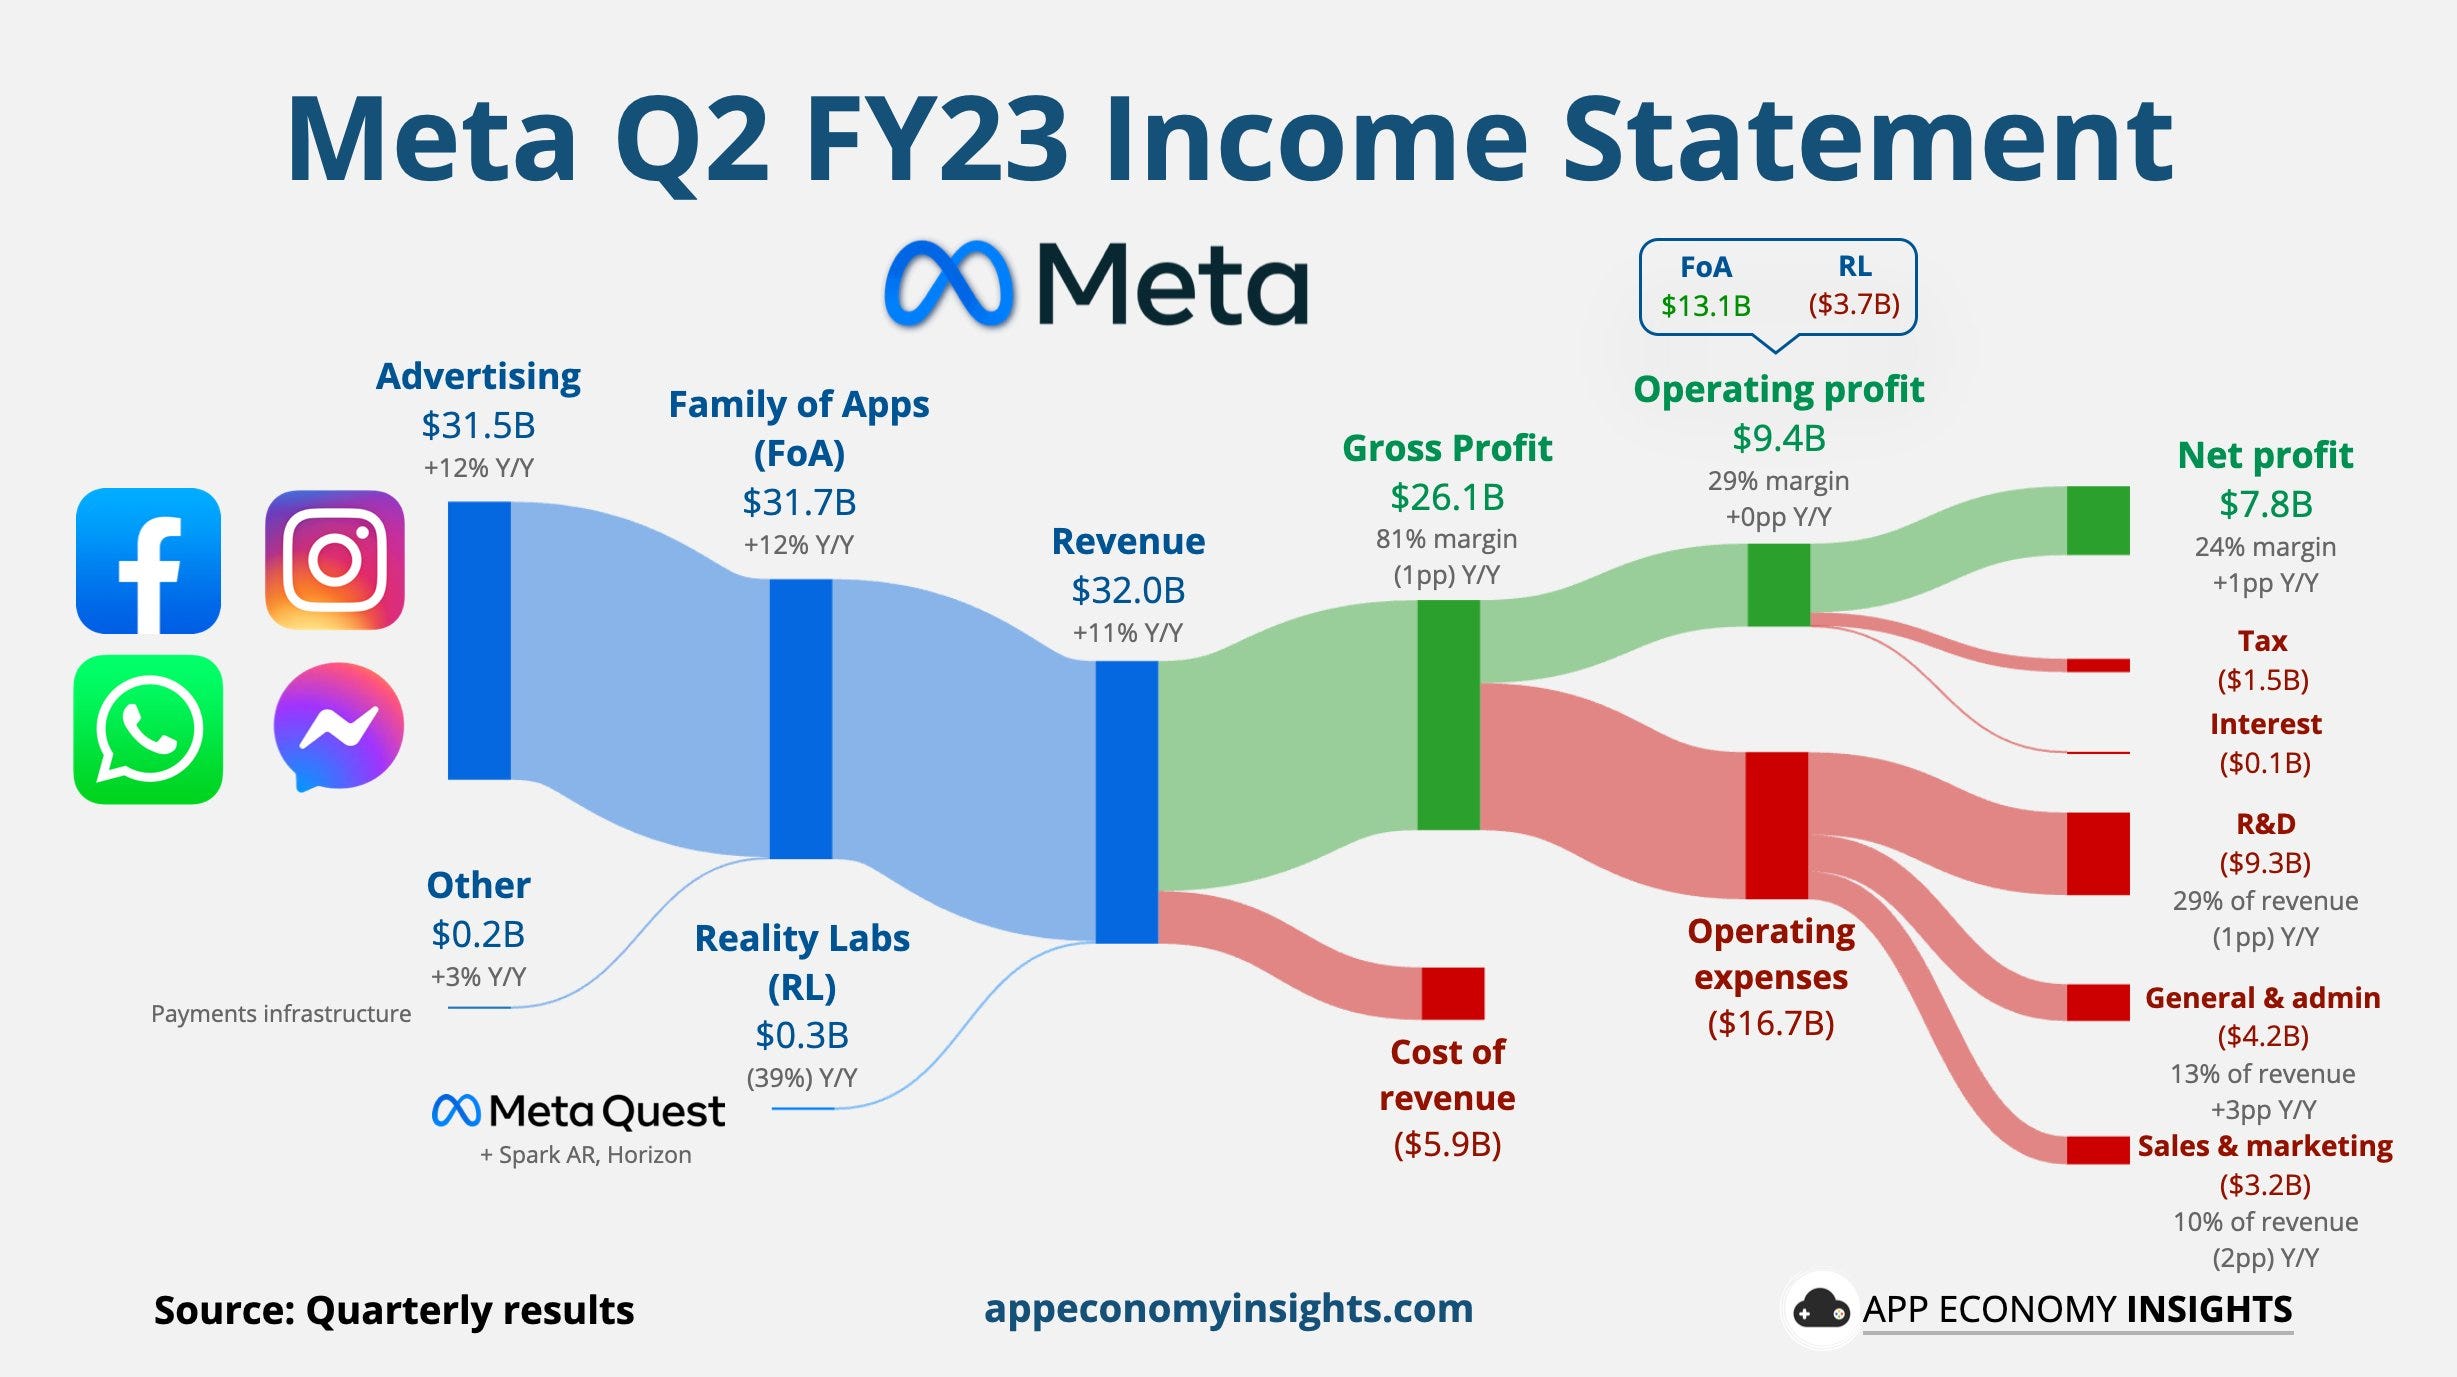
Meta Q2 FY23:
Daily active people +7% Y/Y to 3.07B.
Revenue +11% Y/Y to $32B ($1.2B beat).
Operating margin 29% (flat Y/Y).
FCF margin 34% (+19pp Y/Y).
EPS $2.98 ($0.05 beat)
Q3 FY23 guidance: Revenue ~$32B-$34.5 (~$2B beat).
Following the earnings, META stock price jumped during pre-market.
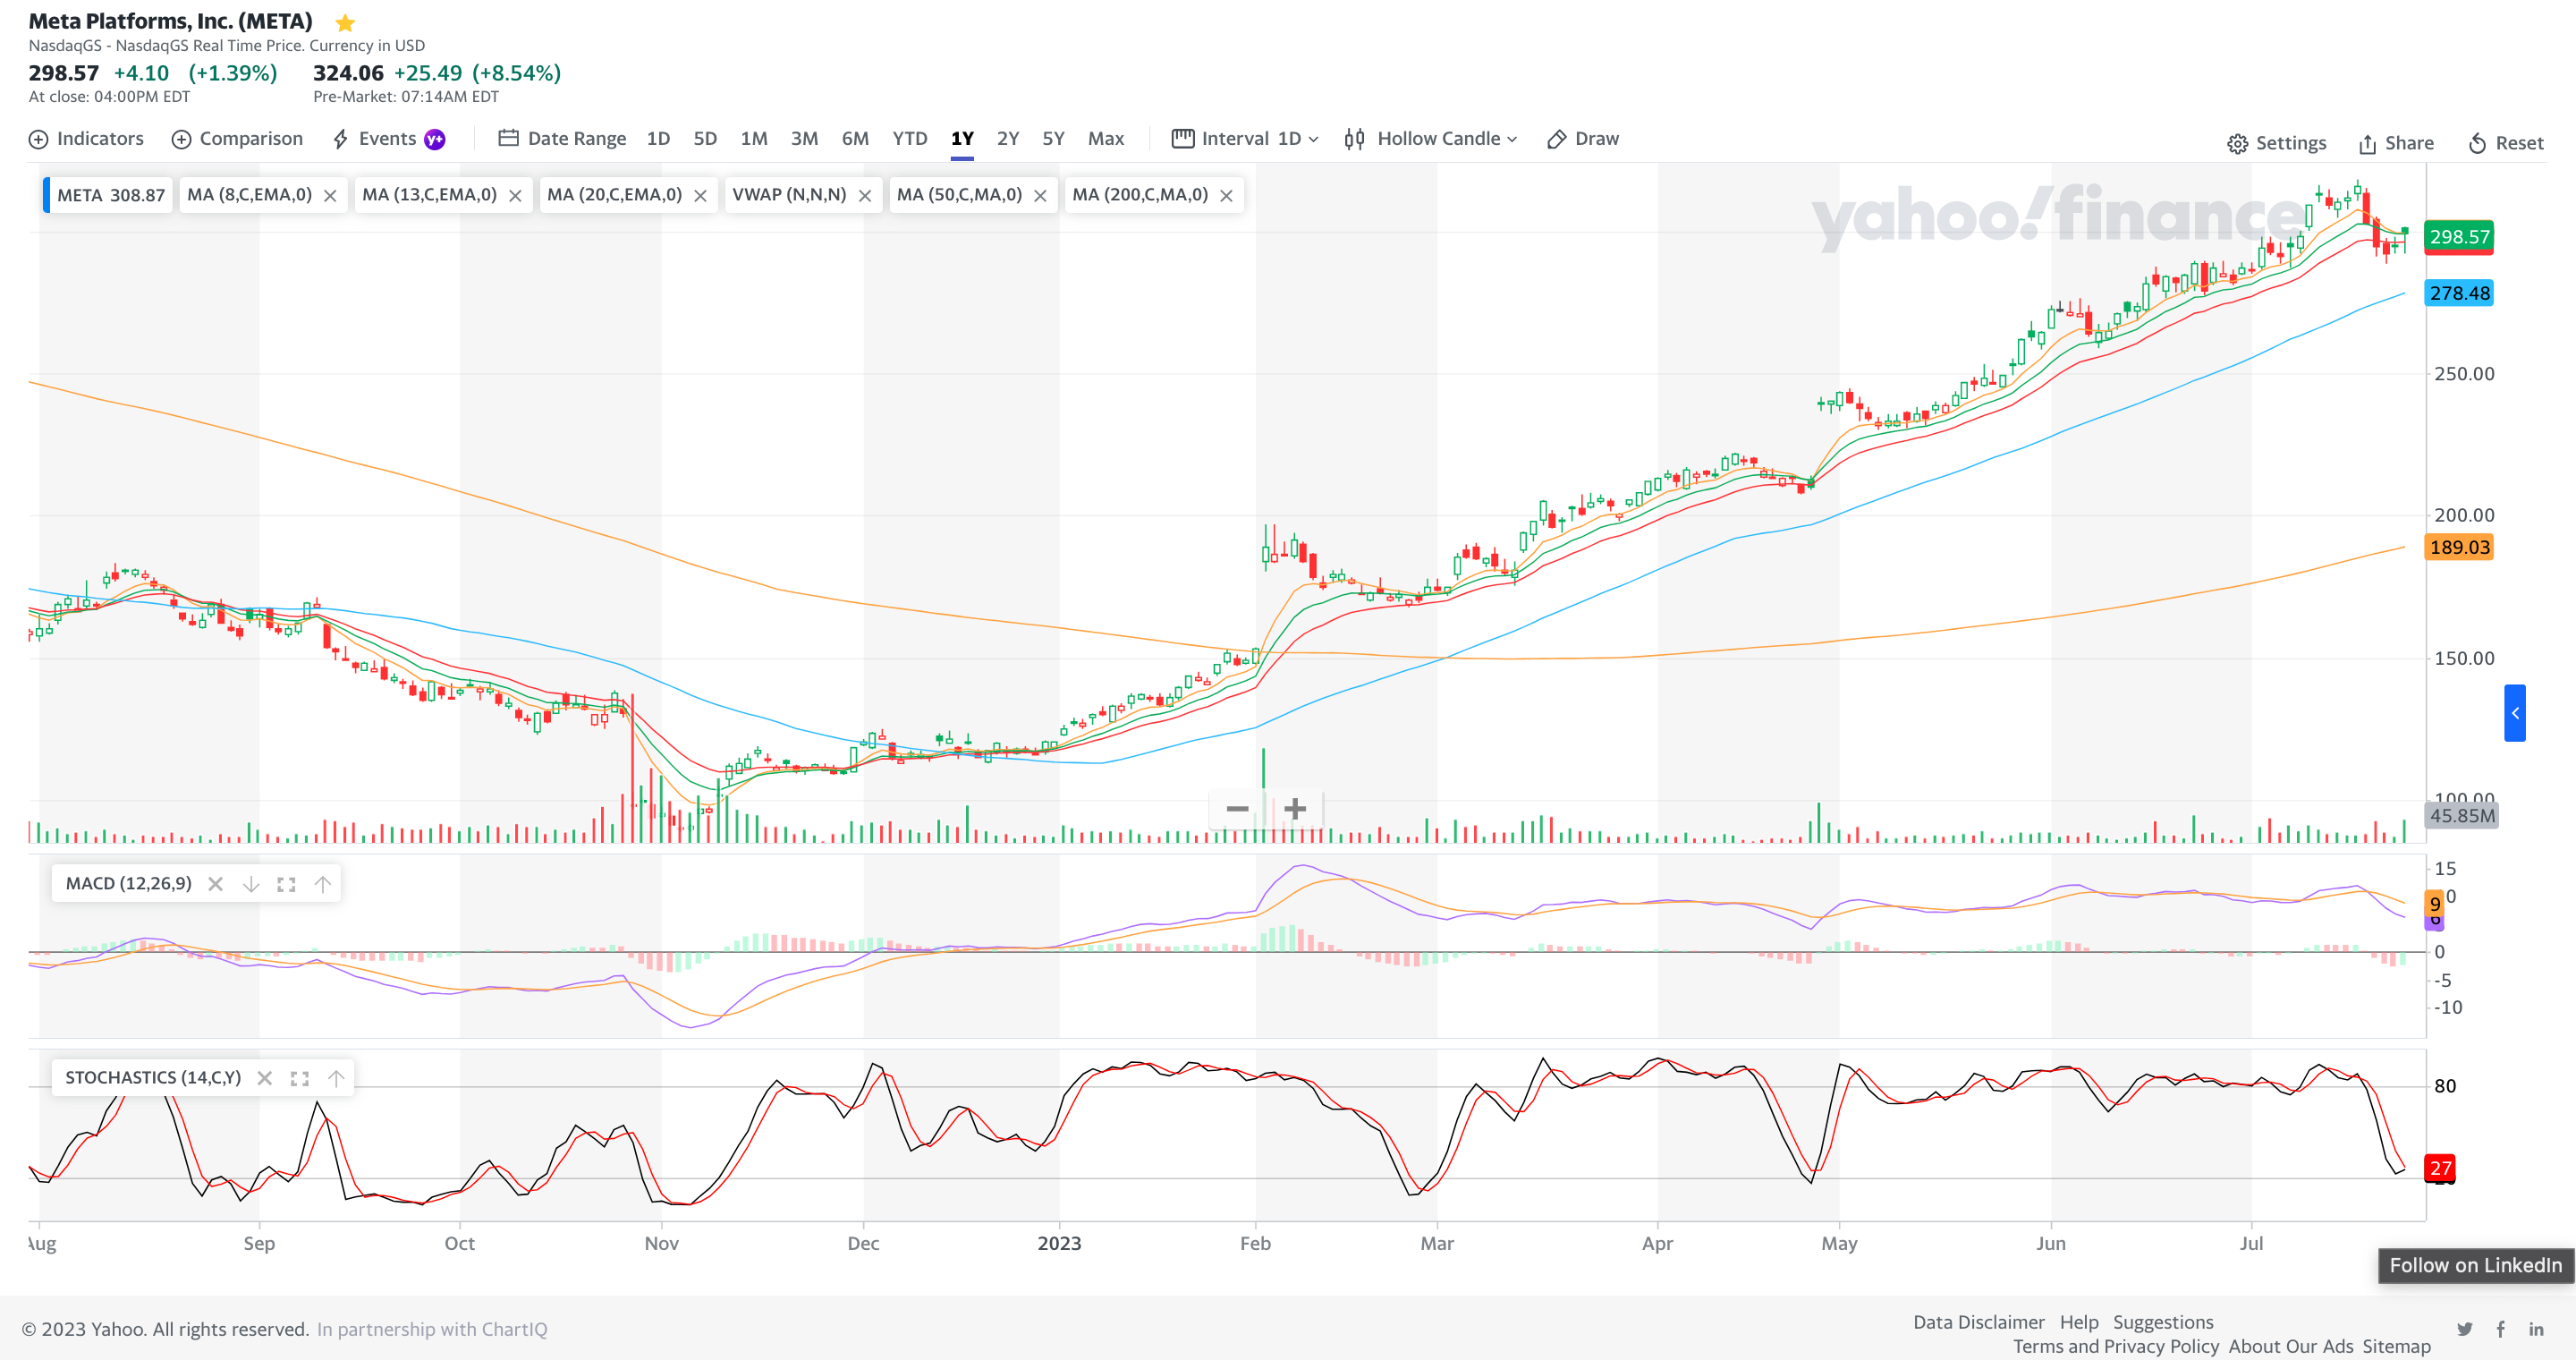
From the chart above, it is a great performance from META from its recent low in November 2022. As of 7.14 am EDT 27July2023, META has jumped 8.54% following earnings.
Now, let us look into the financials to deep dive into the earnings.
Income Statement
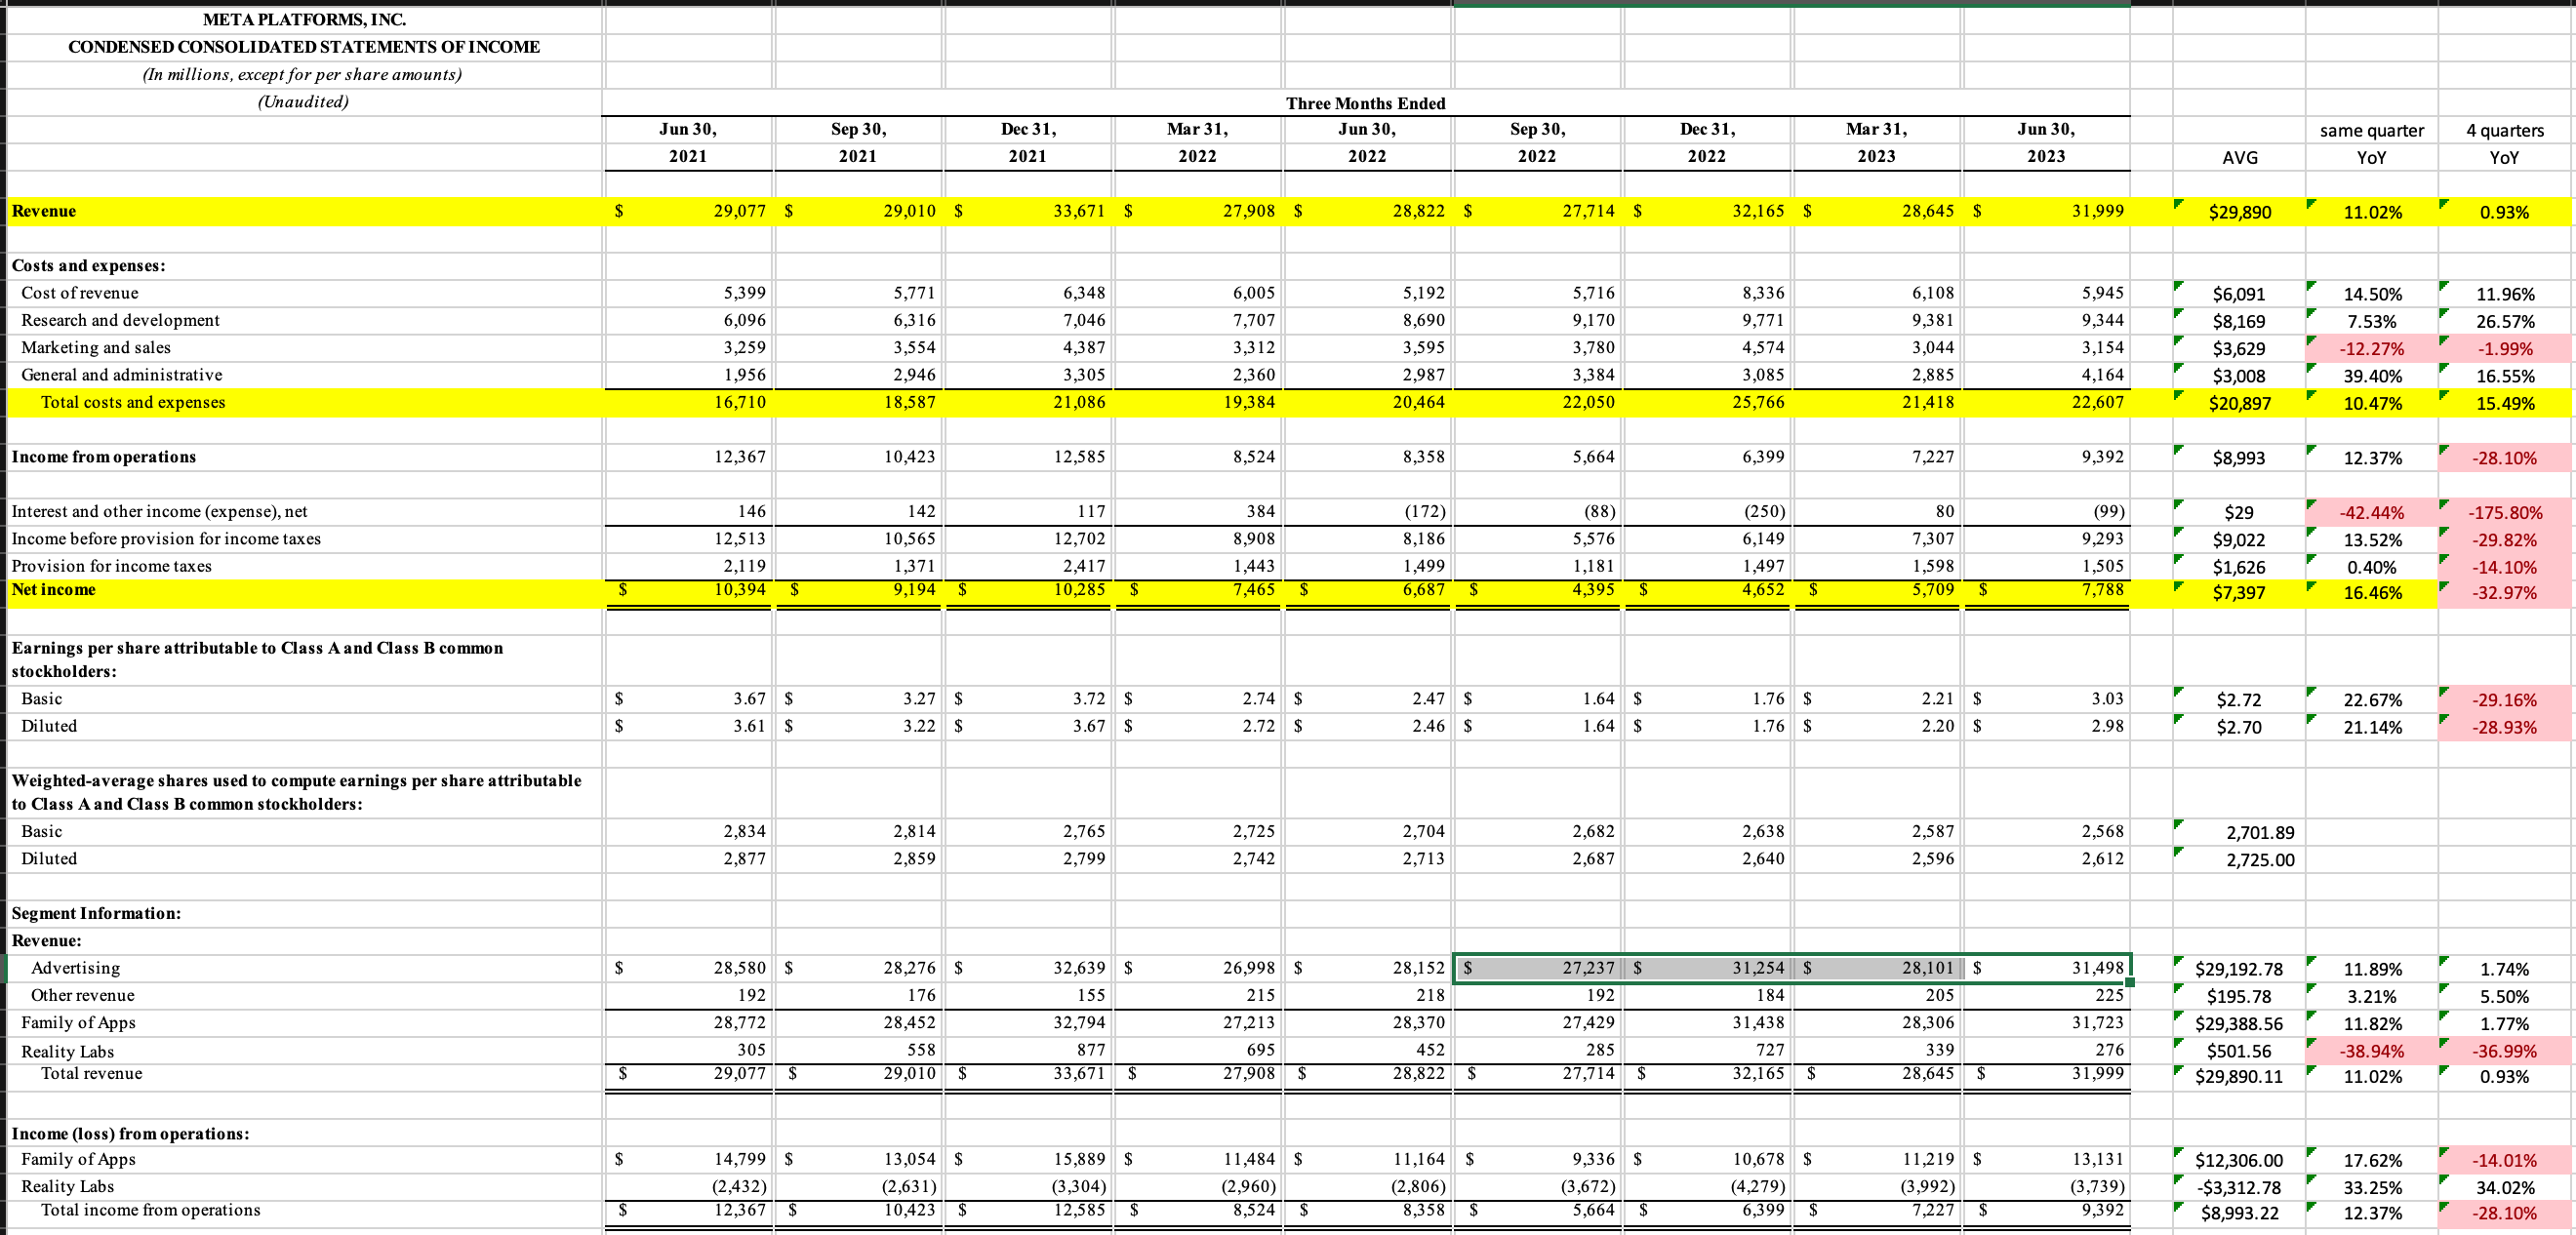
Observations:
(This is comparing 4 quarters ending 30 June 2022 and 4 quarters ending 30 June 2023.)
The increase in total annual revenue is 0.93%
The increase in total annual expenses is 15.49%
As a result, the annual income from operations fell by 28.10%
The annual net income fell by 32.97% to $25.44B
$25.44B is still a very good profit showing. However, the growth in total annual expenses far outweighs the growth in total annual revenue.
Family of Apps revenue grew 1.77%, but saw a drop in profits by 14.01%
On the other hand, Reality lab losses grew 34.02%
Balance Sheet
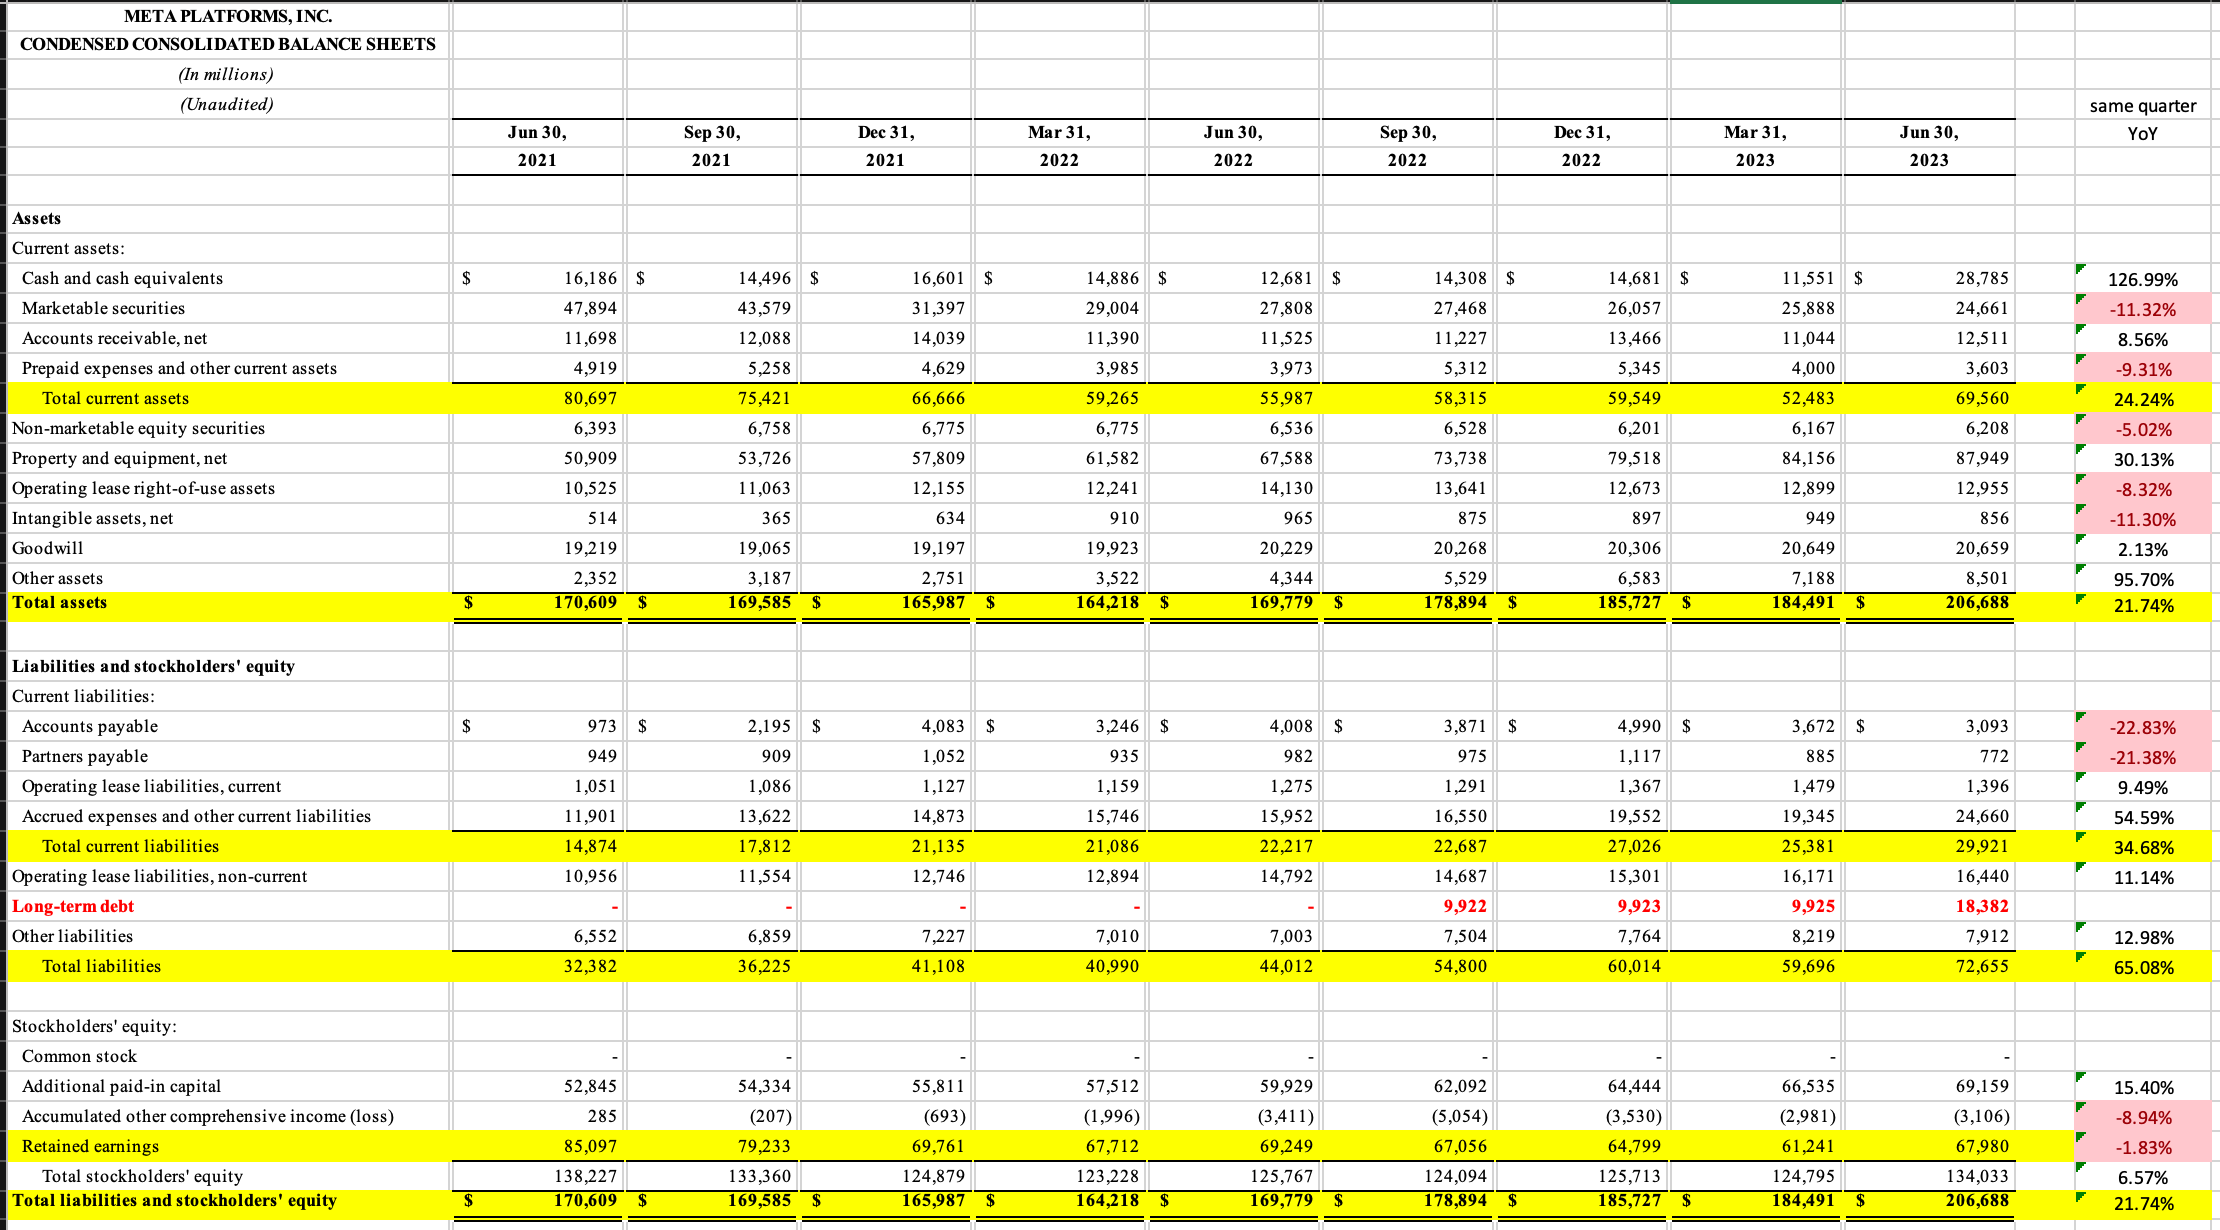
(Comparing 30 June 2023 against 30 June 2022)
Observations:
Current assets grew by 24.24% and Total assets grew by 21.74%
Current liabilities grew by 34.68% and Total liabilities grew by 65.08%
We ended 30 Jun 2023 with retained earnings of $67.98B, a drop of 1.83% from a year ago.
It is to note that we start taking long-term liability $48.15B from the quarter ending 30 Sep 2022. It was not required prior. With increasing interest rates, the payment for the interest will be higher over time. Comparing the 2 latest quarters, there is an increase in long-term liability by almost 80%.
The rate of growth of liabilities is far greater than the rate of growth for assets. This is of concern, especially if this trend continues.
Cash flow statements
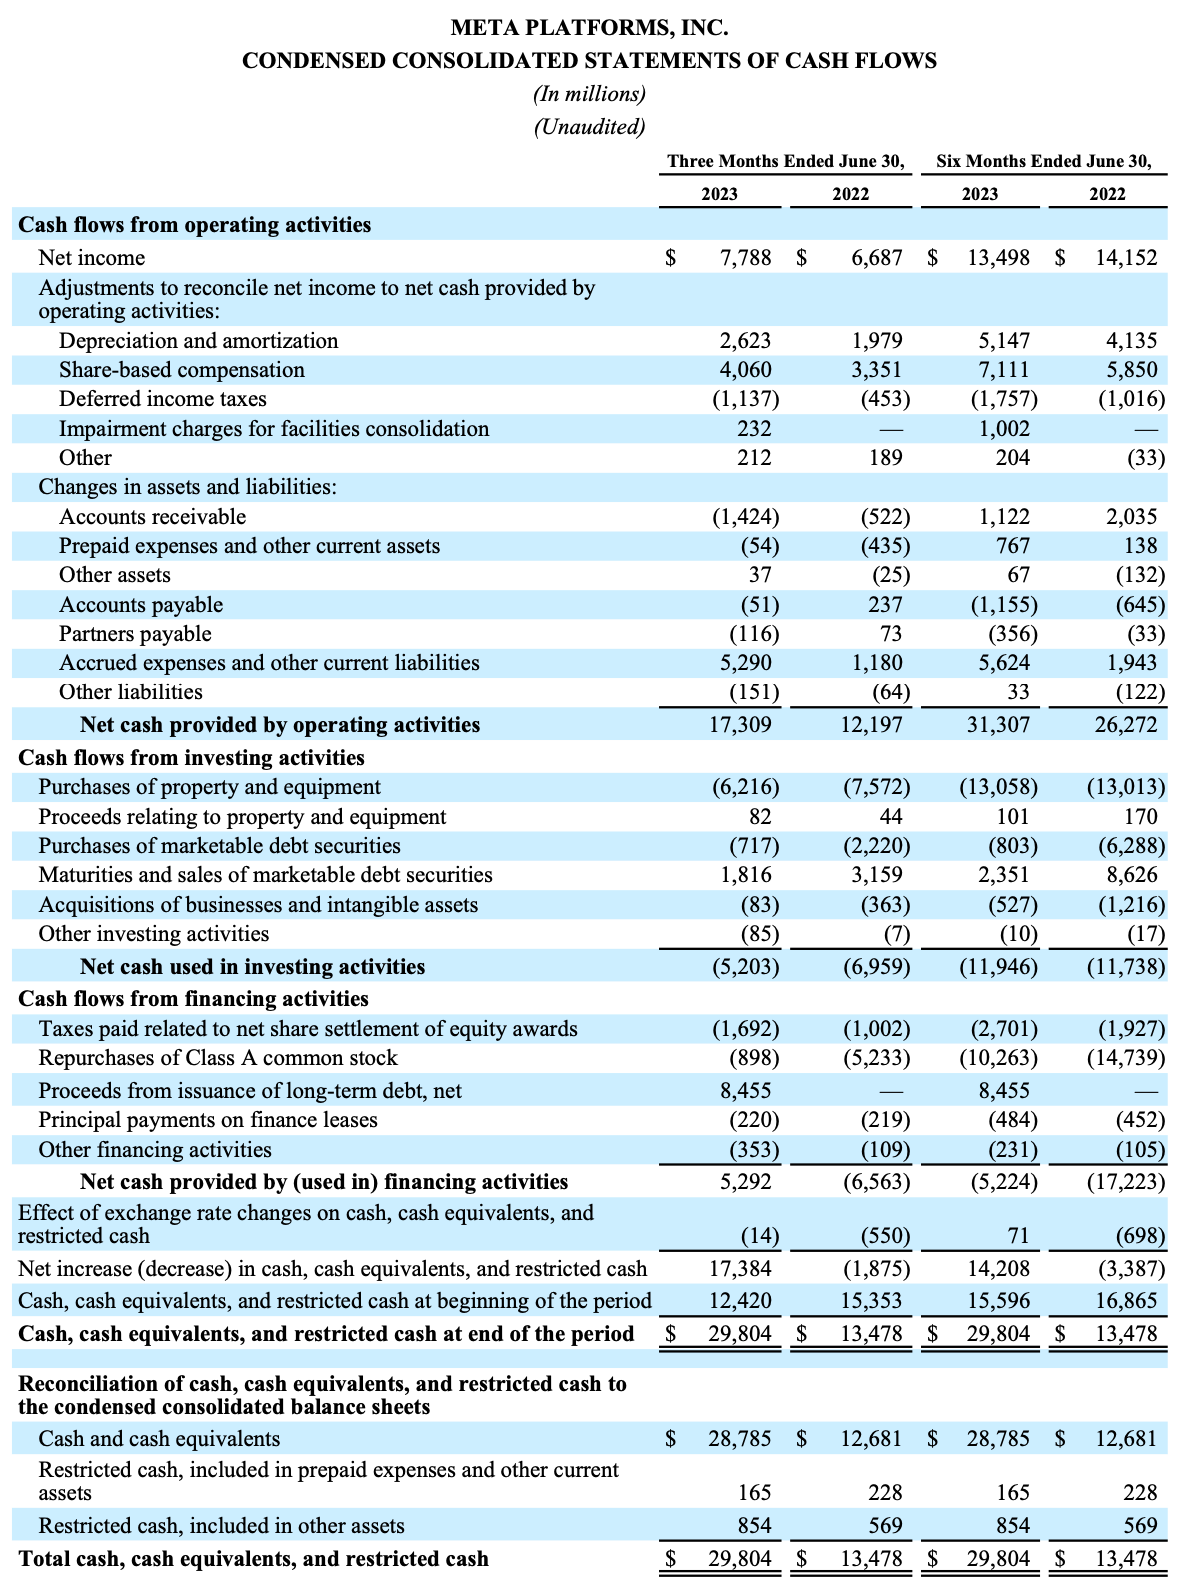
(Comparing 6 months ending 30 June between 2022 & 2023):
CAPEX for the latest 6 months is $13.058B compared to $13.013B in the same period from a year ago.
Free Cash Flow (FCF) is $18.3B compared to $13.2B in the same period from a year ago.
Cash from operations is $31.3B compared to $26.2B in the same period from a year ago.
We incurred a long-term debt of $8.455B when we have a cash, cash equivalent & restricted cash of $29.8B.
Outlook
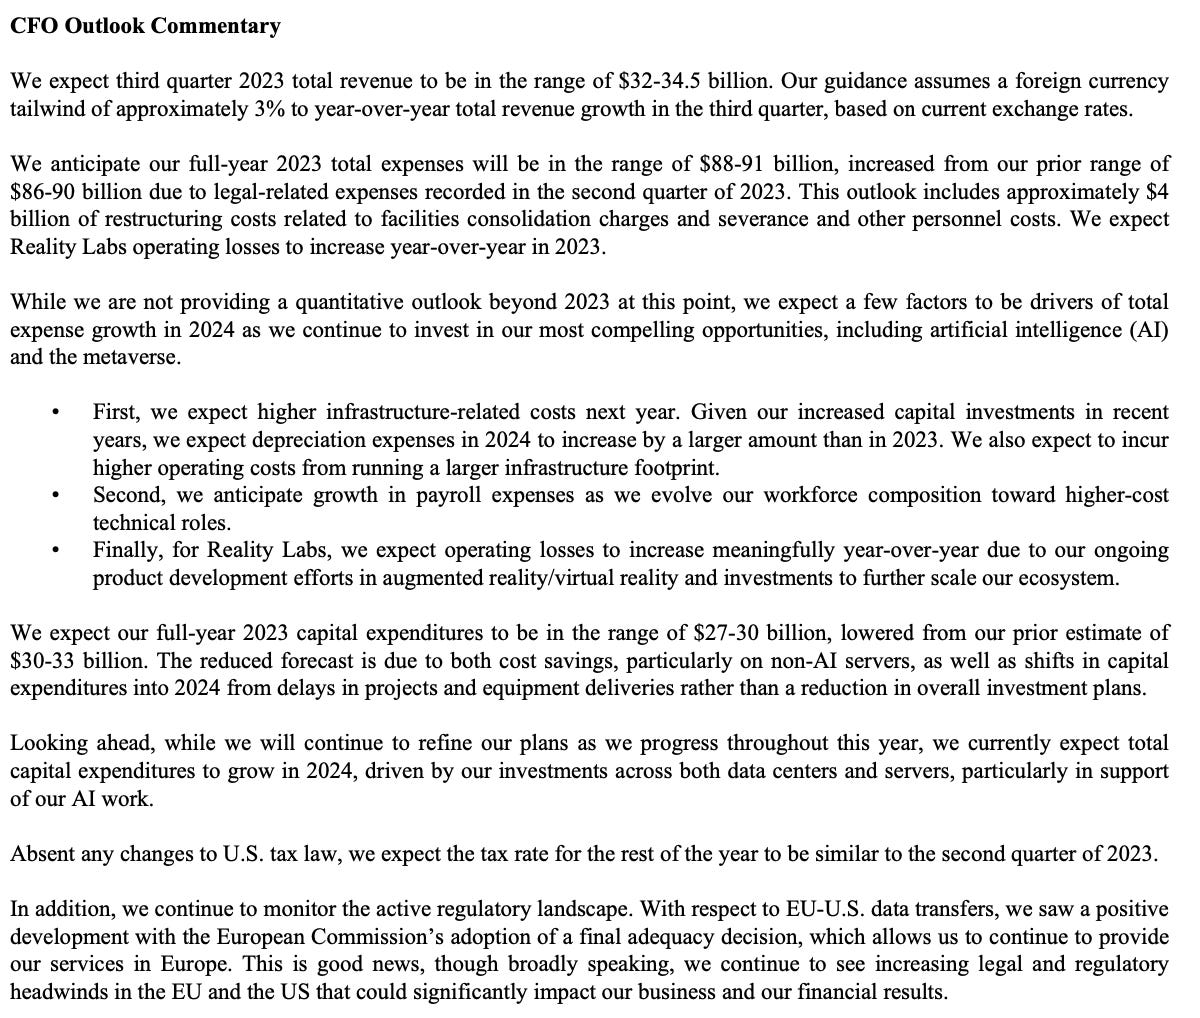
From the observation extracted from the earnings, they are looking at a 3% YoY revenue growth. This is good as the current growth is 0.83%. META has also highlighted the 3 areas incurring more expenses - infrastructure, payroll and more development of Reality Labs (metaverse and related) products. We can look towards the coming earings to hold the management accountable to these expectations.
My ending thoughts
Any company would love to have an annual net income of $25.44B. Beneath the good profits, I have some concerns about the latest earning. The annualized revenue growth is less than 1% but the growth of total annual expenses hit 15.49%. The profit margins are thinning over the quarters. As for Balance Sheet, though we have a debt ratio of 0.35 (total liabilities/total assets) which fell from 0.26 a year ago. The FCF is also getting thin. In essence, all 3 aspects of the financial statement - income statement, balance sheet & cash flow are getting weaker. This trend needs to stop and we look forward to the coming earnings.
Let us continue to trade with caution and invest after research.


Comments
Post a Comment