S&P 500 Earnings - are we heading into a recession? (08Apr2023)
S&P 500 Earnings - Historical Chart
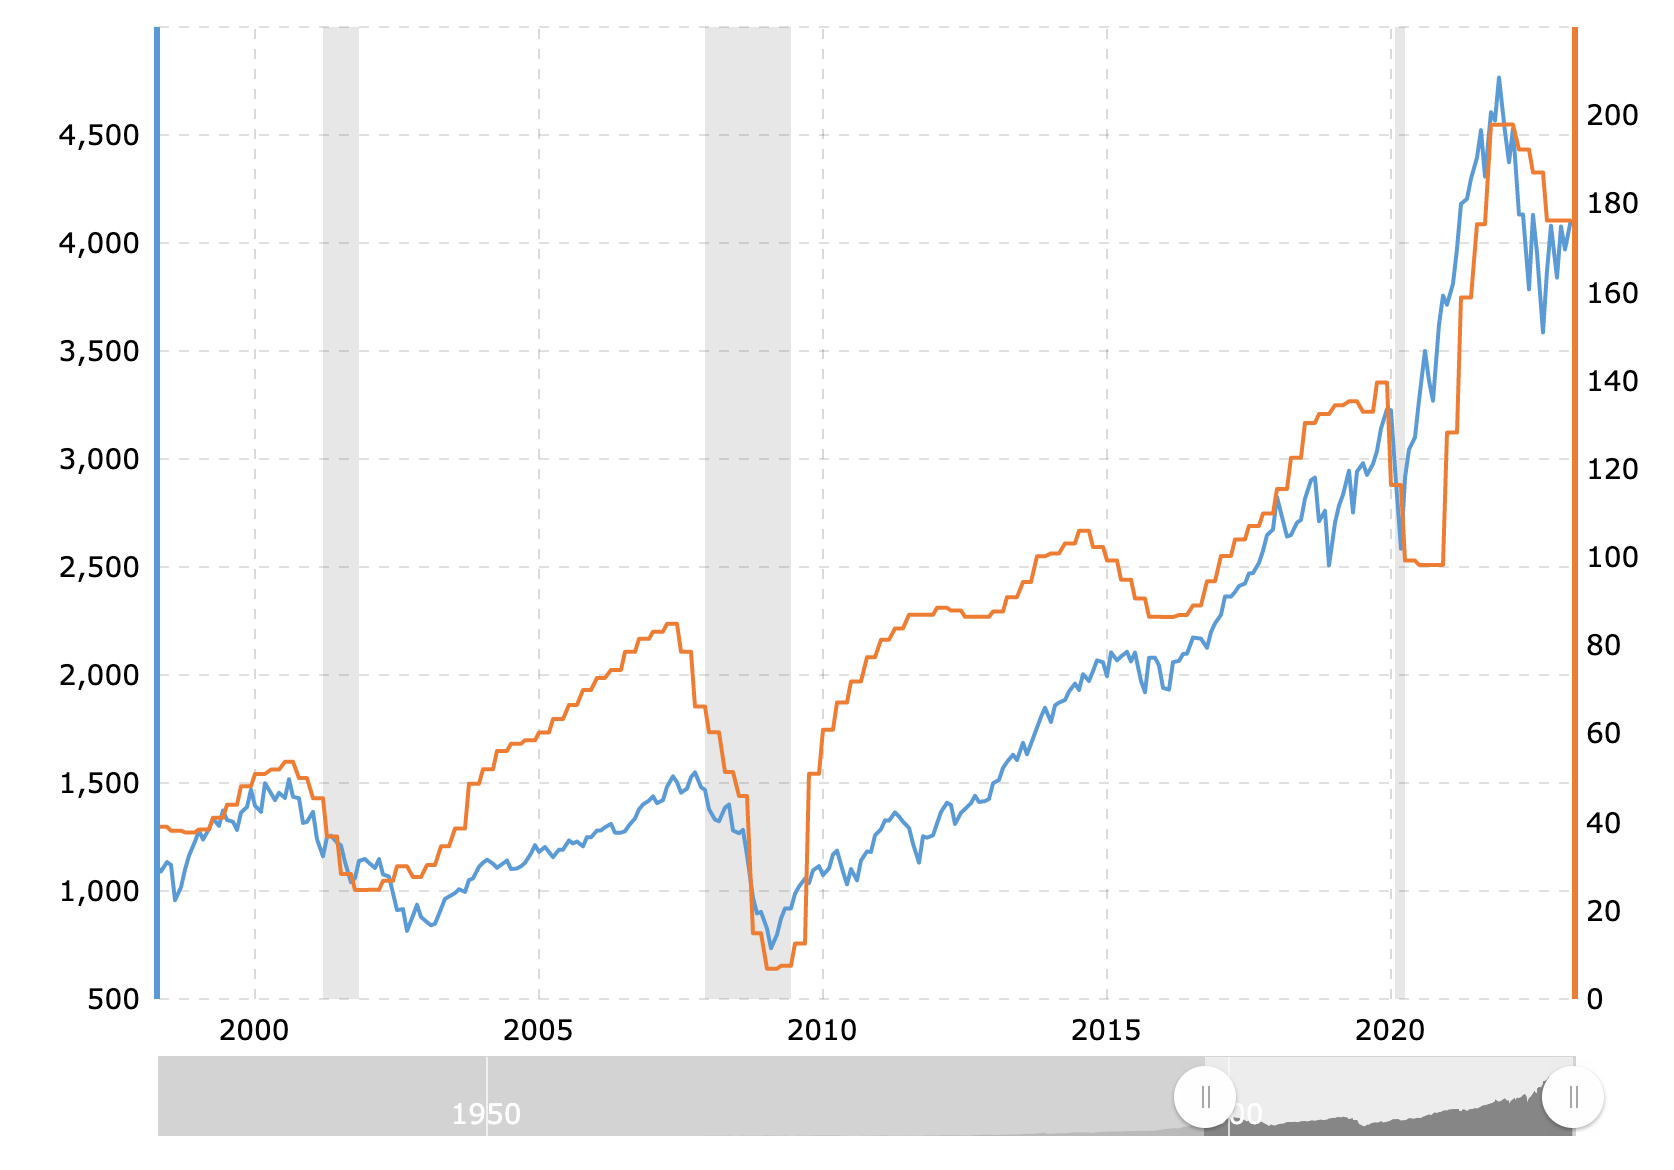
This interactive chart compares the S&P 500 index with its trailing twelve-month earnings per share (EPS) value. Whenever there is a crossover of value, we can expect a recession (area shaded in grey).
This is an observation and there can always be exceptions. Based on the chart below, it has rightly “signalled” the recessions of 2000, 2008 and 2020. However, this is a typical lagging indicator as this crossover typically happens after the recession. This is due to the lagging updates from the quarterly earnings. For 2022, the charts look to point to another potential crossover. Thus, let us continue to be prepared for worsening market conditions.
The following is a chart of the S&P 500 earnings forecast extracted from Gurufocus.
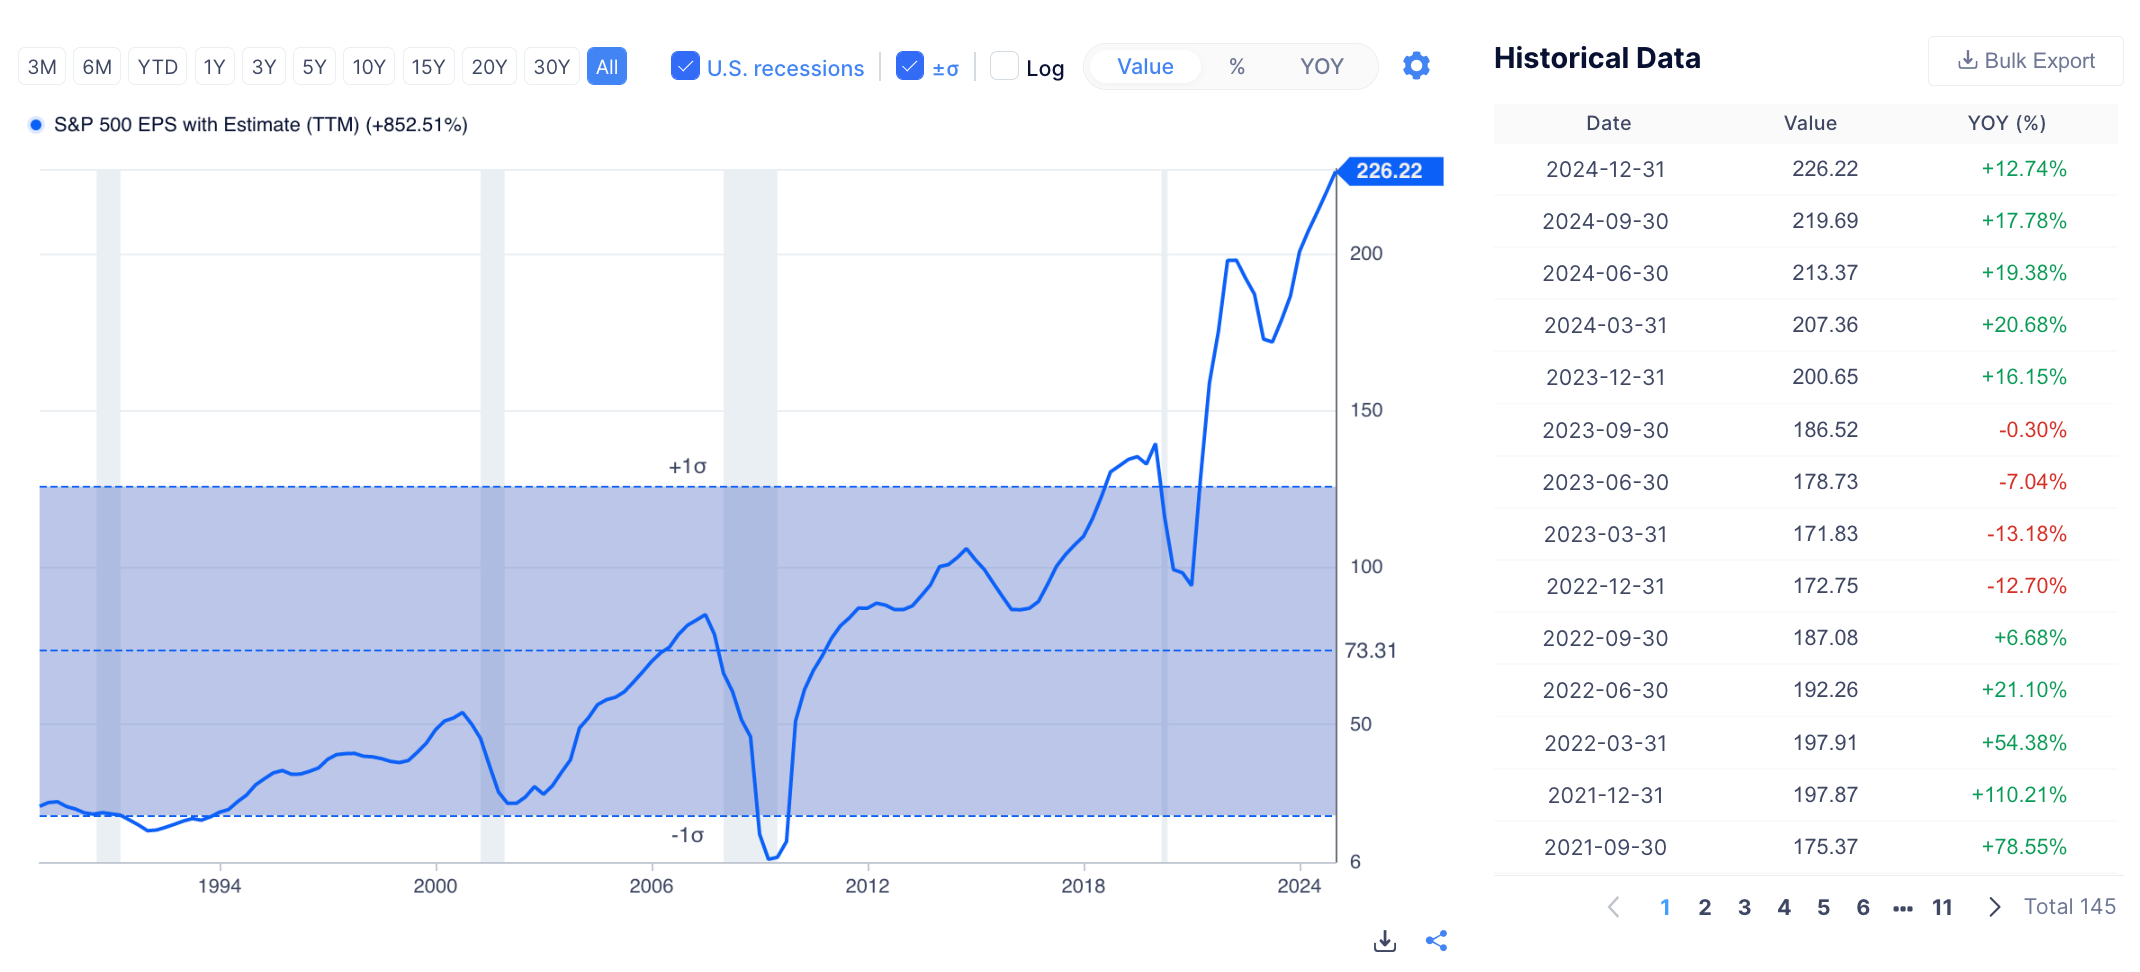
From the estimates, the earnings are expected to be in the red from Q4/2022 to Q3/2023. It will be followed by strong growth from Q4/2023 to the end of 2024.
My investing muse
While it remains an estimate from Gurufocus, it seems to be optimistic about US’s recovery from the global recession. If the world is dragged into a recession, its recovery will consist of many more external factors, not US alone.
With more countries turning away from the US for strategic business partnerships, and using non-USD currency, the de-dollarisation of USD has started.
It is worthwhile considering hedges using non-USD like gold & silver and considering diversification of capital allocations to non-USA markets. While there seem to be some “attractive” deals in the market, I am looking forward to more discounts that accompany the coming recession.


Comments
Post a Comment