Latest US Leading Economic Indicators (LEI) dated 22Jun2023
The following is extracted from the latest LEI update dated 22 Jun 2023.
About the Leading Economic Index and the Coincident Economic Index:
The Leading Economic Index provides an early indication of significant turning points in the business cycle and where the economy is heading in the near term. The Coincident Economic Index provides an indication of the current state of the economy. Additional details are below.
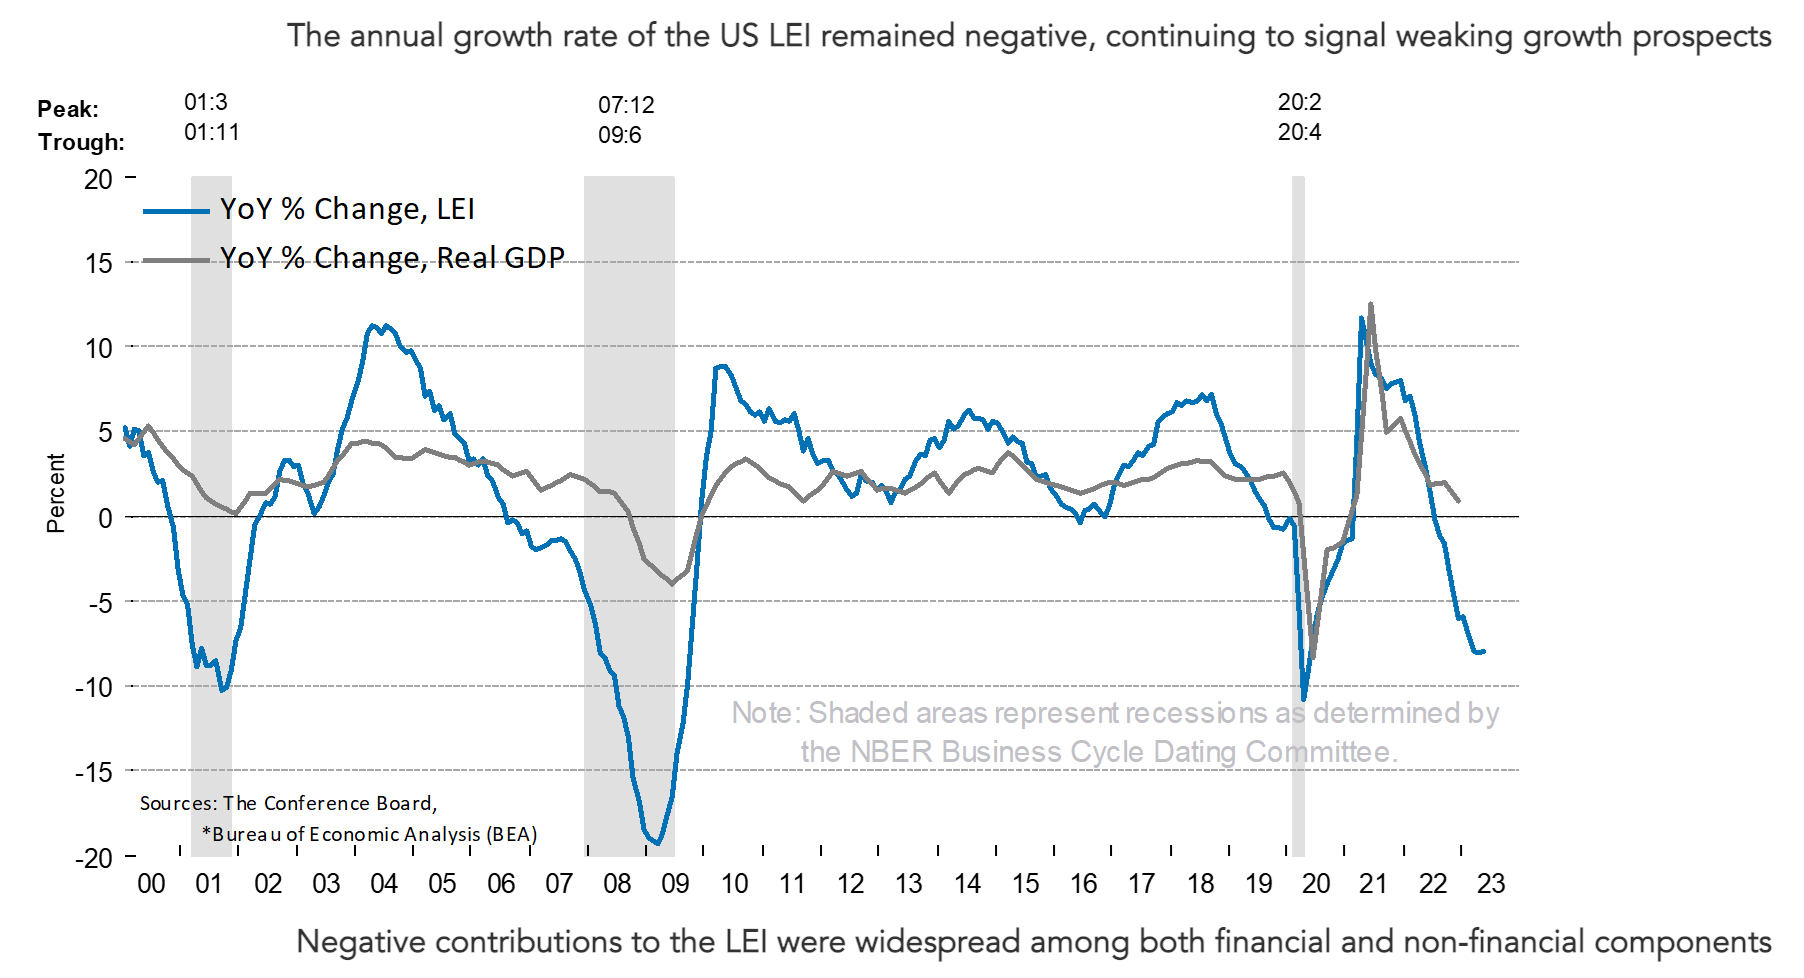
The Conference Board Leading Economic Index® (LEI) for the U.S. declined by 0.7 percent in May 2023 to 106.7 (2016=100), following a decline of 0.6 percent in April. The LEI is down 4.3 percent over the six-month period between November 2022 and May 2023—a steeper rate of decline than its 3.8 percent contraction over the previous six months from May to November 2022.
“The US LEI continued to fall in May as a result of deterioration in the gauges of consumer expectations for business conditions, ISM® New Orders Index, a negative yield spread, and worsening credit conditions,” said Justyna Zabinska-La Monica, Senior Manager, Business Cycle Indicators, at The Conference Board. “The US Leading Index has declined in each of the last fourteen months and continues to point to weaker economic activity ahead. Rising interest rates paired with persistent inflation will continue to further dampen economic activity. While we revised our Q2 GDP forecast from negative to slight growth, we project that the US economy will contract over the Q3 2023 to Q1 2024 period. The recession likely will be due to continued tightness in monetary policy and lower government spending.”
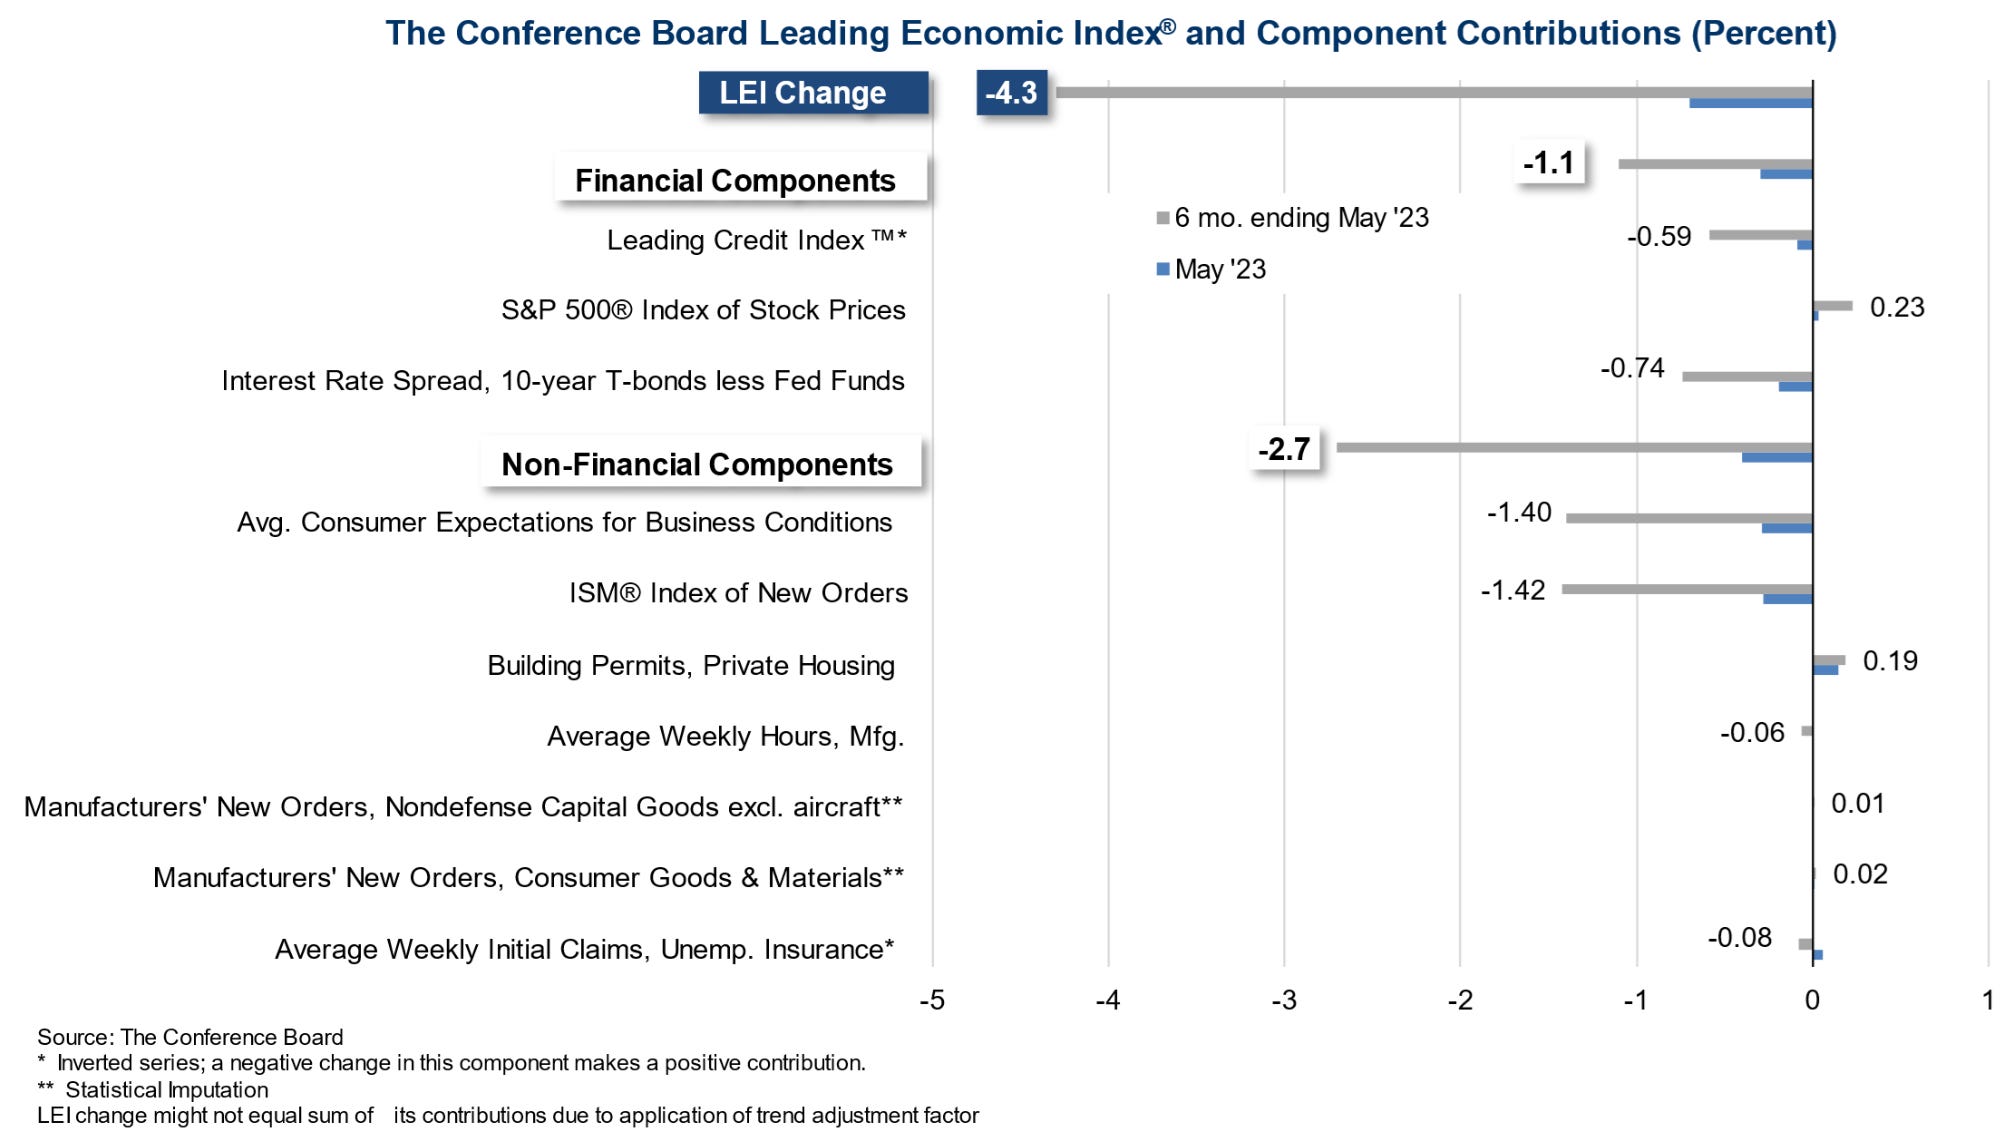
The ten components of The Conference Board Leading Economic Index® for the U.S. include: Average weekly hours in manufacturing; Average weekly initial claims for unemployment insurance; Manufacturers’ new orders for consumer goods and materials; ISM® Index of New Orders; Manufacturers’ new orders for nondefense capital goods excluding aircraft orders; Building permits for new private housing units; S&P 500® Index of Stock Prices; Leading Credit Index™; Interest rate spread (10-year Treasury bonds less federal funds rate); Average consumer expectations for business conditions.
Observations from the latest LEI:
In general, LEI continues to point towards negative economic developments.
There are a few exceptions that have provided good news including:
S&P500 index stock prices
Bulk permits for private housing
Manufacturers’ new orders (nondefense capital goods excluding aircraft)
Manufacturers’ new orders (consumer goods & materials)
Overall, the LEI is still down at -4.3%
My investing muse
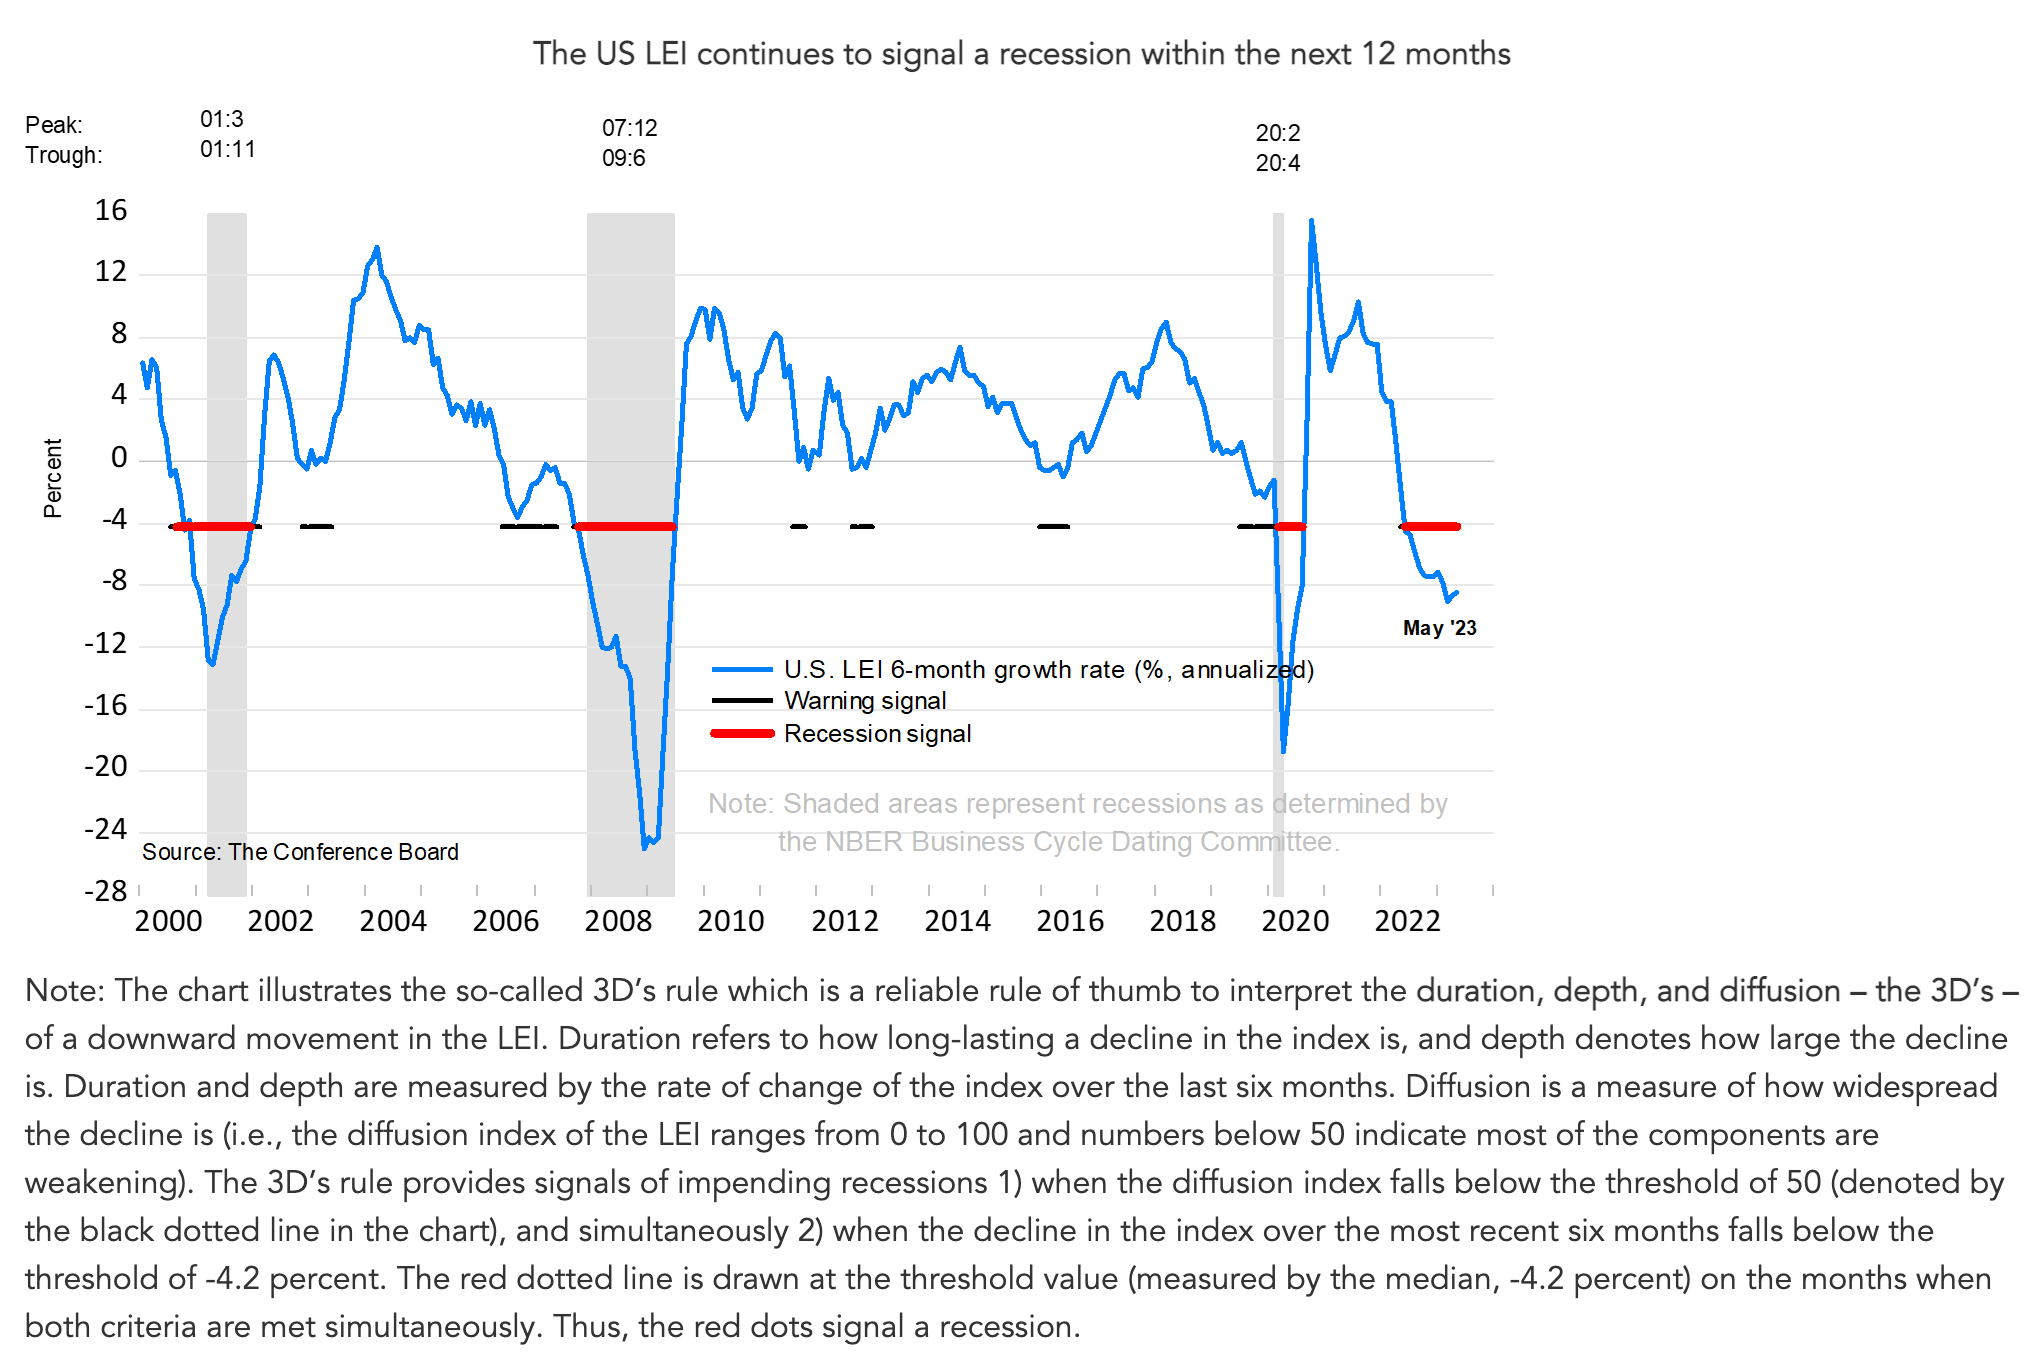
As per the chart above, the US LEI has been accurate to signal a recession since the year 2000. We could expect a recession given the list of financial and non-financial components. There is no doubt that the market is on a bull run currently.
Thus, I recommend considering some hedging so that we are able to weather some of the volatility ahead. With Q1/2023 GDP revised upwards from 1.3% to 2.0%, we can expect much optimism in the market. Looking at economic data (beyond GDP, inflation & unemployment) may provide a more balanced view of the economic conditions.
There is money to be made and let us plan this out accordingly. I recommend different strategies in play during bull and bear markets. Let us research before we invest.


Comments
Post a Comment