How can we gauge the momentum of S&P500 rally?
The 18th July 2023 US market closed with a small gain of 0.71%.
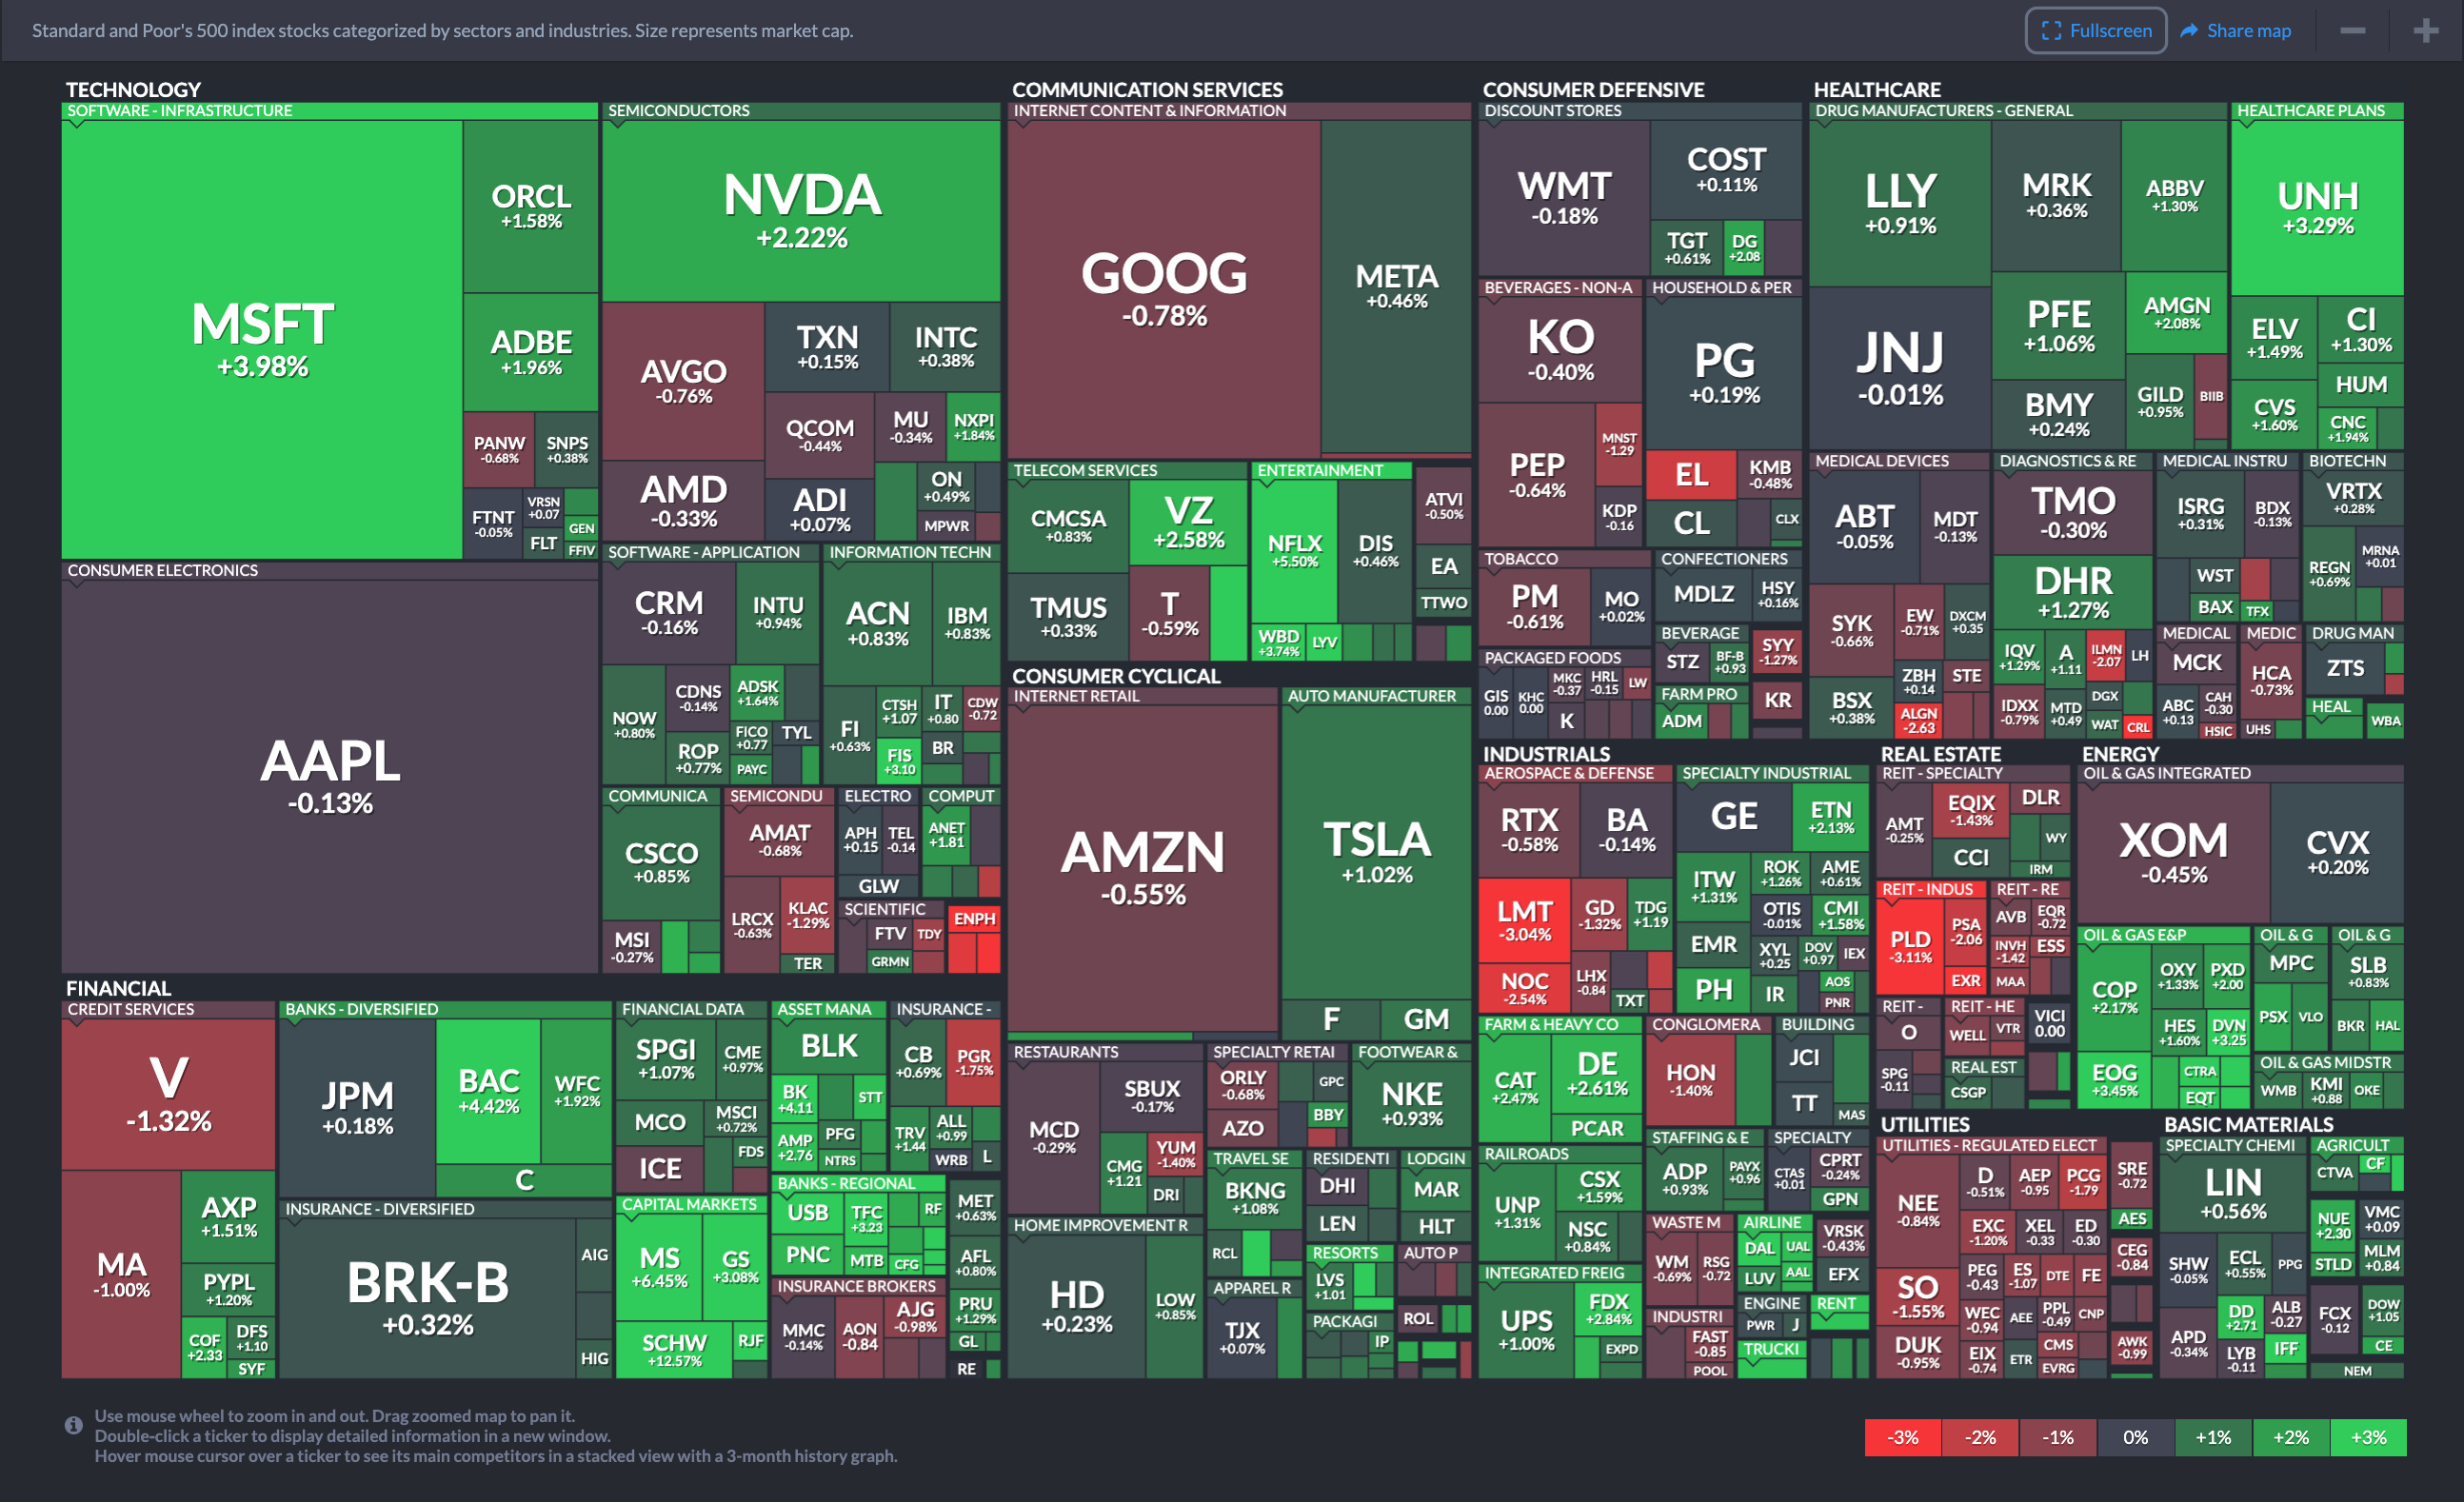
Some of the players that ended in green include Microsoft, Nvidia, Bank of America, Morgan Stanley and Goldman Sachs. This is not surprising following beats in earnings by some of these companies.
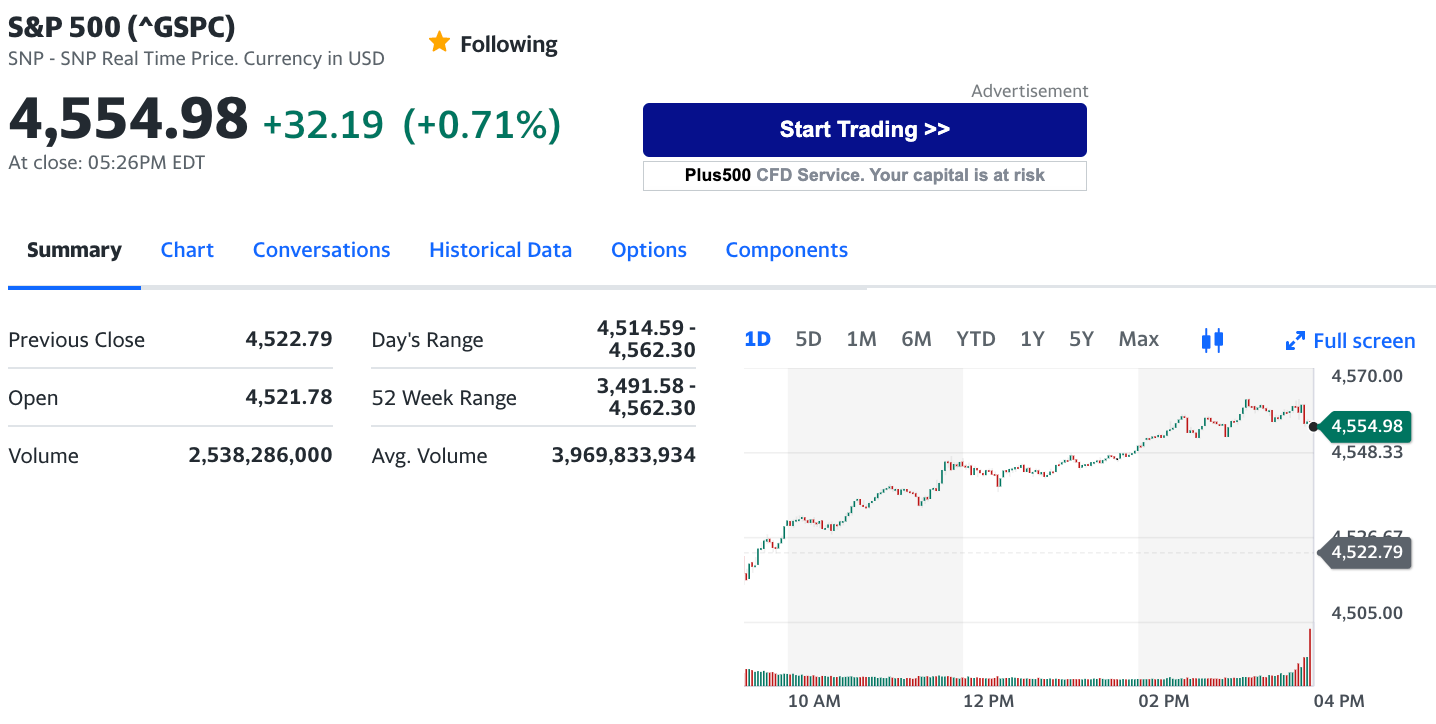
As per the screenshot from Yahoo Finance above, the average volume of S&P500 is 3.96B as of 05:26 pm EDT.
Investopedia defines the volume as the following:
Volume measures the number of shares traded in a stock or contracts traded in futures or options. Volume can indicate market strength, as rising markets on increasing volume are typically viewed as strong and healthy. When prices fall on increasing volume, the trend is gathering strength to the downside.
Conclusion
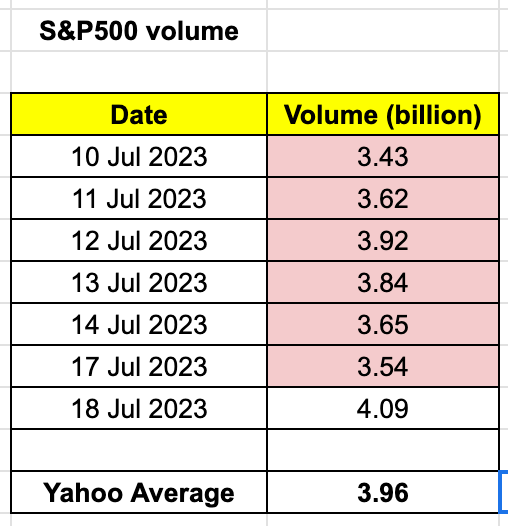
S&P500 volume for the last few days:
Volume seen across a few days can be seen as the momentum of the current trend. If the trading volume remains strong, it implies strength in the current trend. One of the references that I would use would be the average trading volume. The above is done for S&P500, with the intent to reference the US market as a whole.
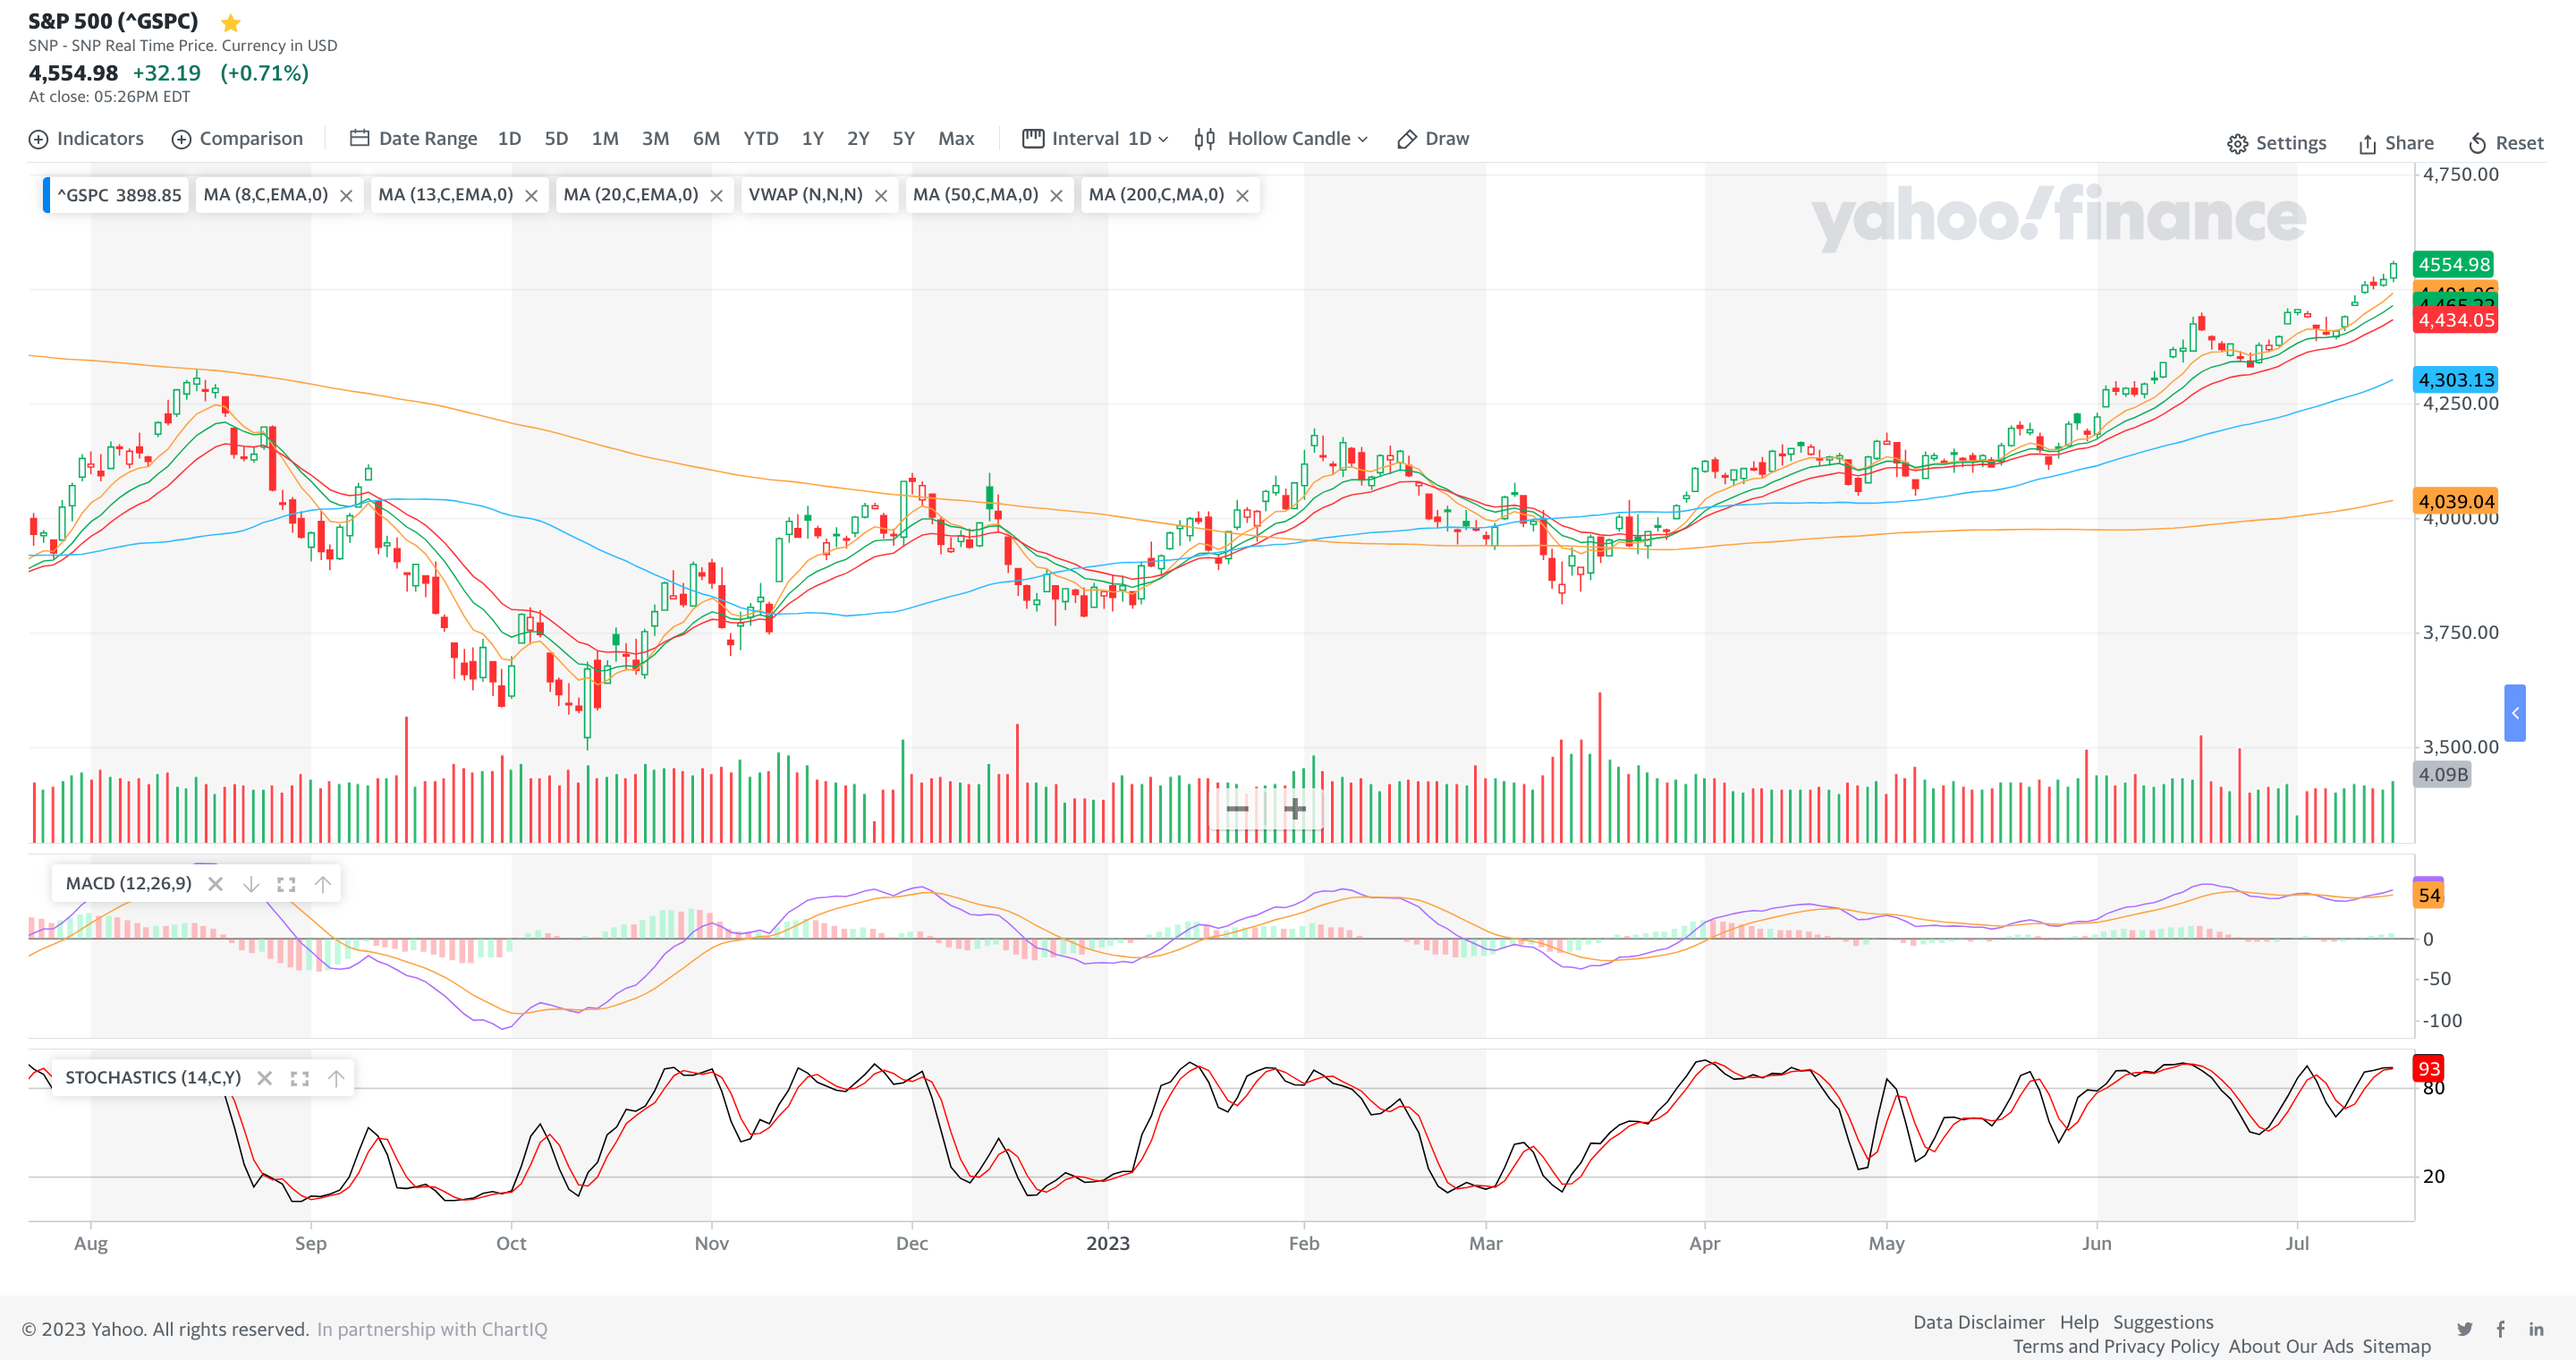
While the S&P500 (1D chart) continues its upward trend, we can note that the recent volume (except for 18 July 2023) has been weaker than the average volume of 3.96B.
With the 18 July 2023 volume being above the average, it is possible that the trend can continue as seen by the MACD indicator. The candlesticks are also above the 50-day moving average line, implying bullish in the short to mid-term.
Let us look back to 16 June 2023, when there was a sizeable trading volume at 6.85B. It was followed by the market decline over the following days. With the trading volume dropping, the decline eventually ended, as the bear lost its momentum.
The earnings season can provide good reasons for the market to remain bullish or show concern. Using these lagging indicators like MACD, these are just reflecting how the market has behaved. I would recommend monitoring the volume of the individual stocks to understand if the momentum remains. Currently, it is not convincing that the momentum can continue for S&P500. But the earnings & macro data can play their part over here.


Comments
Post a Comment