Are the leading economic indicators (LEI) trending down? (11May2023)
This report is based on The Conference Board which publishes leading, coincident, and lagging indexes designed to signal peaks and troughs in the business cycle for major economies around the world. Latest Press Release (Updated: Thursday, April 20, 2023)
Extract from the 20 Apr 2023 press release:
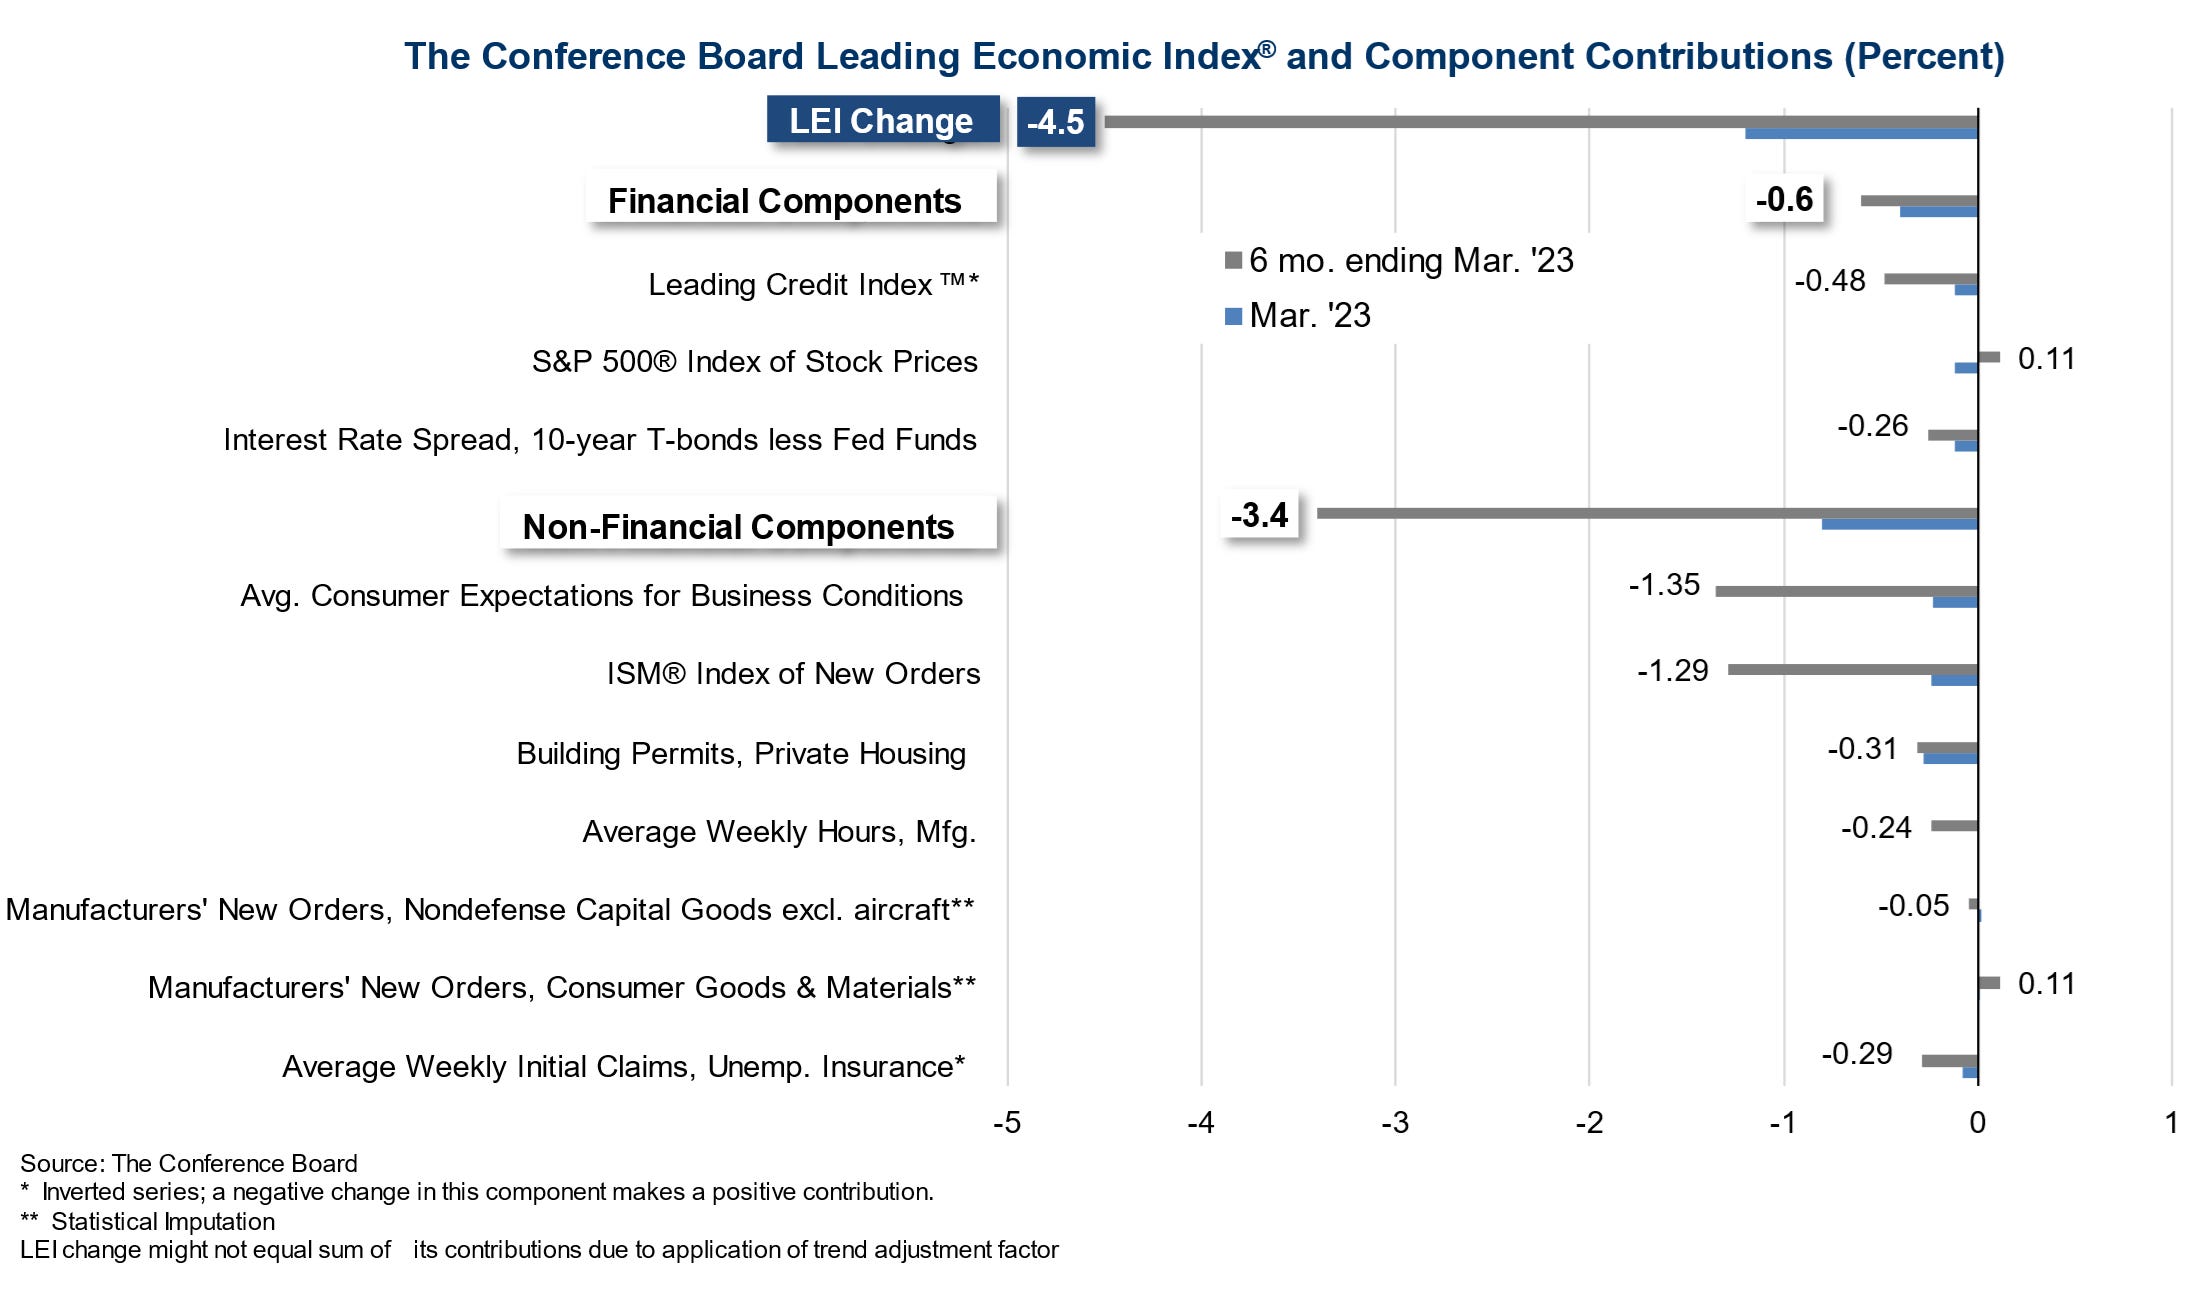
The Conference Board Leading Economic Index® (LEI) for the U.S. fell by 1.2 percent in March 2023 to 108.4 (2016=100), following a decline of 0.5 percent in February. The LEI is down 4.5 percent over the six-month period between September 2022 and March 2023—a steeper rate of decline than its 3.5 percent contraction over the previous six months (March–September 2022).
“The U.S. LEI fell to its lowest level since November of 2020, consistent with worsening economic conditions ahead,” said Justyna Zabinska-La Monica, Senior Manager, Business Cycle Indicators, at The Conference Board. “The weaknesses among the index’s components were widespread in March and have been so over the past six months, which pushed the growth rate of the LEI deeper into negative territory. Only stock prices and manufacturers’ new orders for consumer goods and materials contributed positively over the last six months. The Conference Board forecasts that economic weakness will intensify and spread more widely throughout the US economy over the coming months, leading to a recession starting in mid-2023.”
Structure of The Conference Board Leading Economic Index (LEI) ~ extract from the website
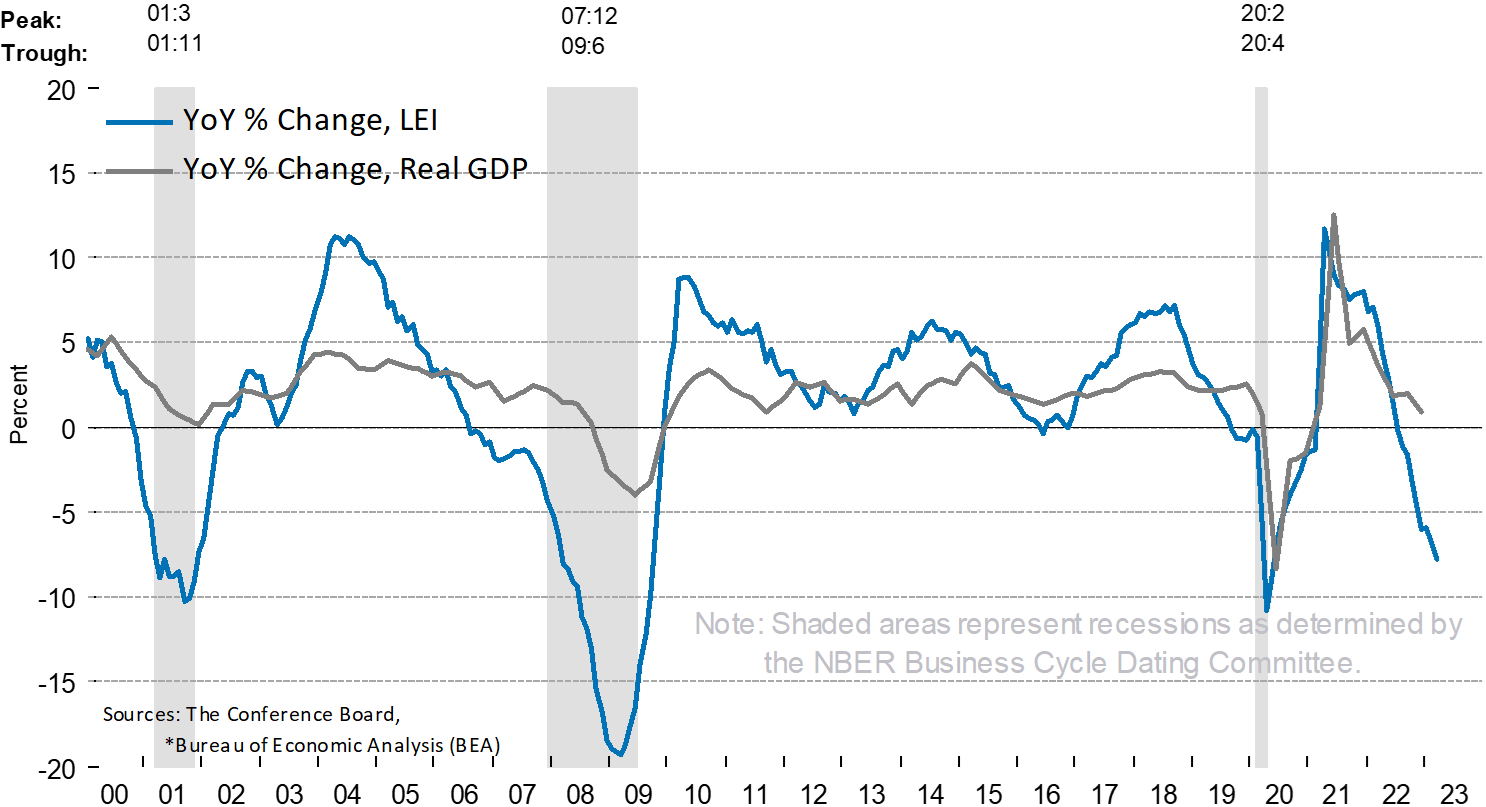
About The Conference Board Leading Economic Index® (LEI) for the U.S.: The composite economic indexes are the key elements in an analytic system designed to signal peaks and troughs in the business cycle. The indexes are constructed to summarize and reveal common turning points in the economy in a clearer and more convincing manner than any individual component. The CEI is highly correlated with real GDP. The LEI is a predictive variable that anticipates (or “leads”) turning points in the business cycle by around 7 months. Shaded areas denote recession periods or economic contractions. The dates above the shaded areas show the chronology of peaks and troughs in the business cycle.
The ten components of The Conference Board Leading Economic Index® for the U.S. include: Average weekly hours in manufacturing; Average weekly initial claims for unemployment insurance; Manufacturers’ new orders for consumer goods and materials; ISM® Index of New Orders; Manufacturers’ new orders for nondefense capital goods excluding aircraft orders; Building permits for new private housing units; S&P 500® Index of Stock Prices; Leading Credit Index™; Interest rate spread (10-year Treasury bonds less federal funds rate); Average consumer expectations for business conditions.
Observations:
From the chart above,the YoY % change in real GDP (after removal of inflation) is on a downtrend since 2021. Should the trend continues., the real GDP % change should enter negative (decline).YoY % change of LEI continues the downtrend, falling to its lowest level since November 2020.
Observations (based on the last 6 months ending March 2023):
- LEI has fallen 4.5%.
- Financial Components ~ has dropped 0.6%
- Leading Credit index has dropped 0.48%
- S&P 500 index stock price is one of the 2 indicators that has risen by 0.11%
- Interest Rate Spread (10 year T-bonds less Fed Funds) continues a decline of 0.26%
Non-Financial Components ~ has fallened 3.4%
Average consumer expectations for business conditions has dropped 1.35% ~ consumers are expecting worsening business conditions- ISM index of new orders fell 1.29% ~ this implies that there are lesser new orders, lesser economic activities
- Building permits (private house) has fallen 0.31% ~ this implies lesser private houses being built
- Average weekly hours (manufacturing) has dropped 0.24% ~ this implies that there is lesser work (labour hours) in manufacturing
- Manufacturers’ new orders for nondefense capital goods excluding aircraft has dropped 0.05% ~ such orders have reduced.
- Manufacturers’ new orders for consumer goods & materials has increased 0.11%. This is the area that has picked up and remained 1 of the 2 positives
- Average weekly initial claims for unemployment insurance has dropped 0.29% ~ this implies that there is lesser claims arising from lesser unemployment.
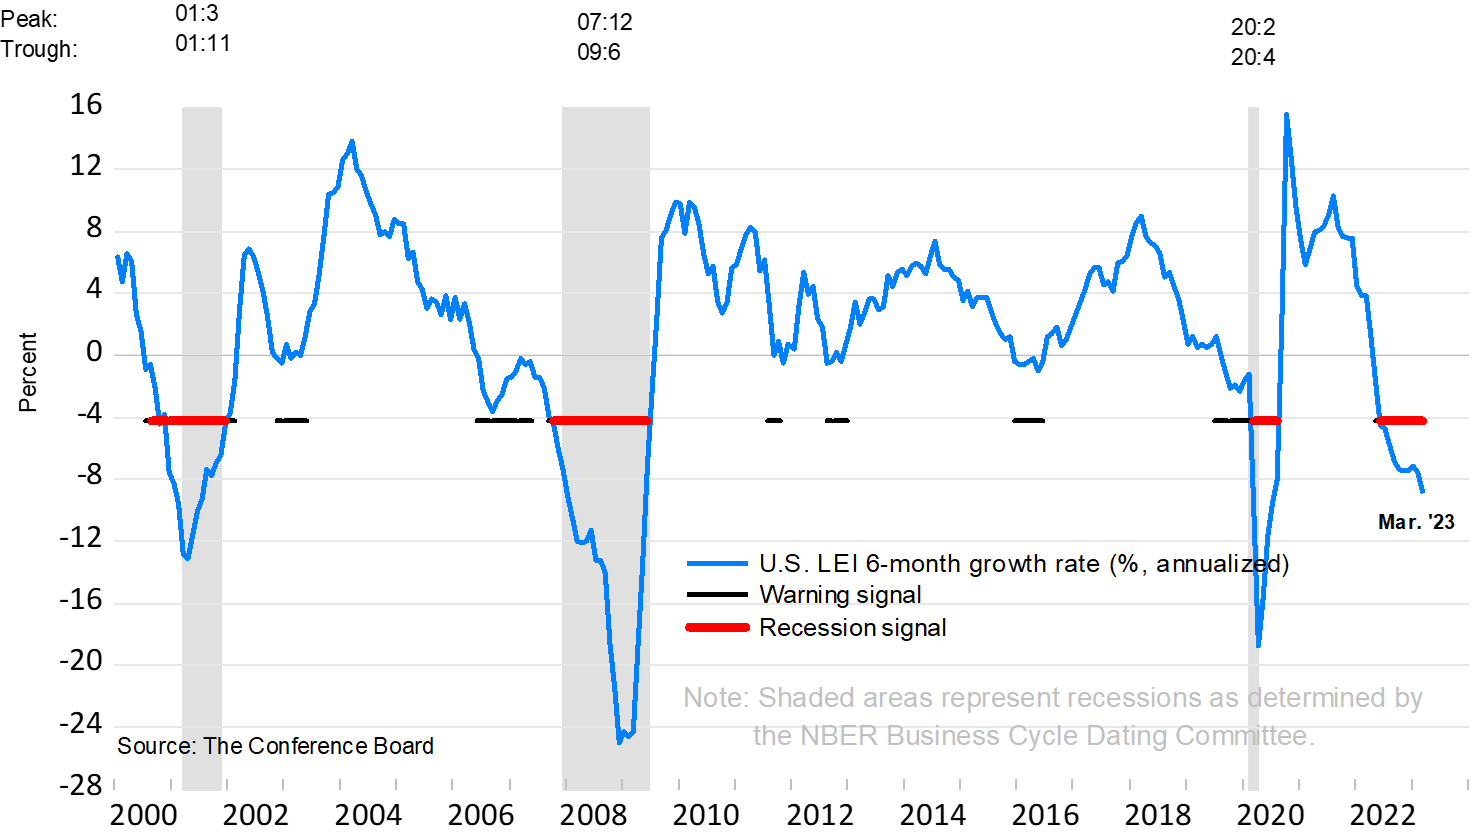
As per the chart above, the latest update from March 2023 has continued to fall in the recession signal zone. The LEI 6-month growth rate (%, annualized) of over -8% has continued to be on a downward trend, approaching the levels of 2000-2001 recession (-12%).
My investing muse
We are not trending in the right direction based on the LEI. From the data set above that covered credit, S&P500 index, inverted yield, manufacturing orders, consumer expectations, home property and working hours, we have a wide-based consideration that has being accurately predicting recessions since 2000. Some would argue that there are other components that need to be included and weightage review. This remains a much-rounded consideration on top of other macro data like GDP, inflation rate and unemployment rate.
It is needful that we remain hopeful for the best while being prepared for the worse. The recent earnings have left a slightly positive note. There are also concerns raised for the outlook and the banking crisis has added to the concerns. Let us consider more defensive stocks and hedging should we foresee a recession heading our way.


Comments
Post a Comment