Is the S&P500 a good reflection of the US economy?
Is the S&P500 a good reflection of the US economy?
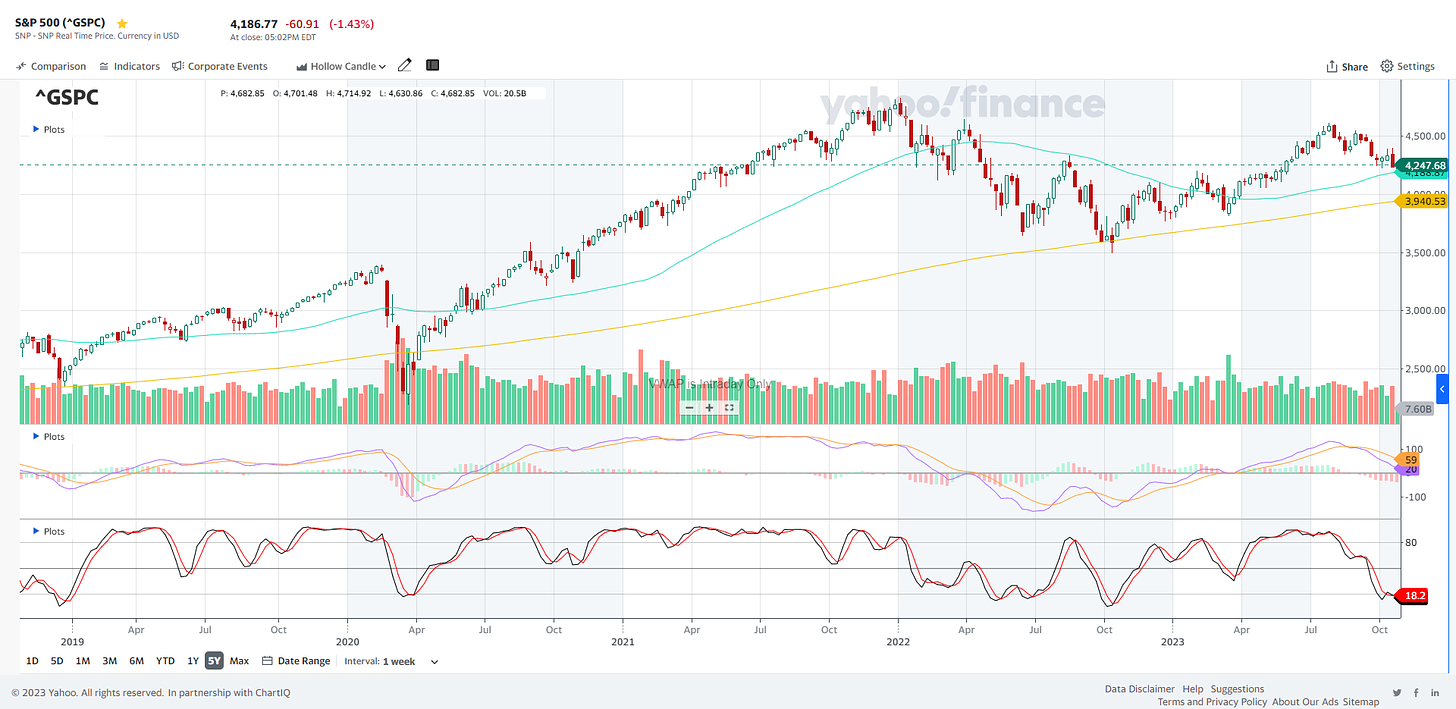
As more Americans struggle with the cost of living, the S&P500 is currently in decline. Is this a reflection of the US economy or is this a good gauge of the global economy?
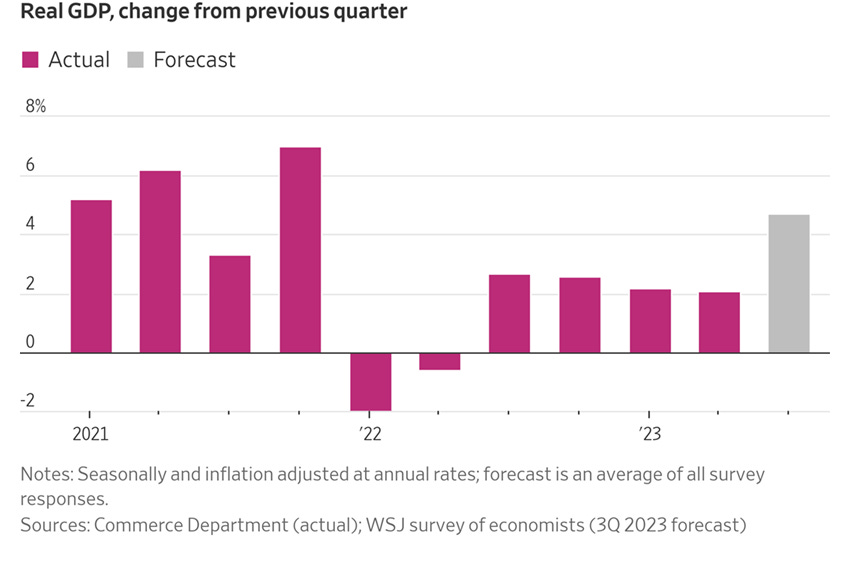
The latest Q3/2023 GDP figure released has revealed a strong robust economy. US GDP soared to a 4.9% in Q3/2023. This is the highest since the end of 2021 and a big jump from 2.1% in Q2/2023. From various sources, strong consumer spending and government spending drove the growth. Does this mean that the recession is over? Is this sustainable in lieu of the Federal, commercial, and private debts?
Revenue sources of S&P500 companies
Extract from the article from Globalxetfs:
Companies that generate a substantial part of their revenue from outside of the U.S. could experience additional earnings compression, albeit with a lag. Roughly 40% of S&P 500 revenues are generated outside of the U.S., and about 58% of Information Technology company sales were sourced from abroad. Many S&P 500 companies have warned about the negative impacts of a strong dollar. For example, during the second quarter earnings season, some U.S. multinational firms forecasted lower profit growth because of the strong dollar, and the rise in currency volatility could disrupt some hedging programs.2
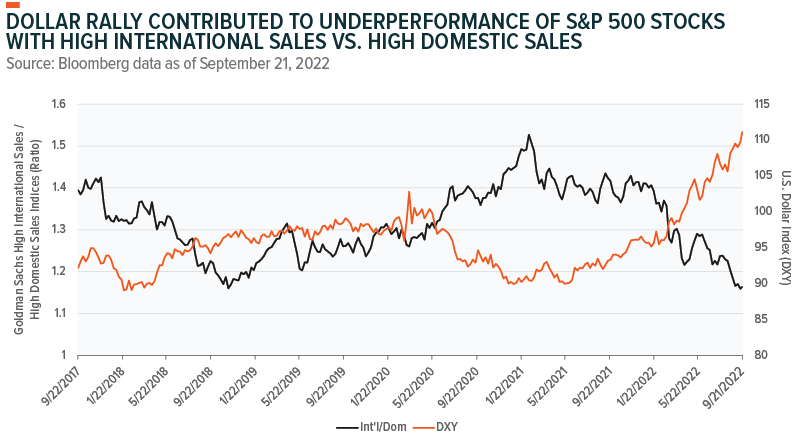
We expect earnings expectations to decline as multinational firms realize foreign exchange headwinds that accelerated over the past year. So far, markets have started to price in negative impacts of a strong dollar. Goldman Sach’s index of S&P 500 stocks with the greatest share of non-US revenues has significantly underperformed S&P 500 stocks with high domestic revenues over the past year. And problems in Europe could exacerbate the eventual earnings hit from abroad.
With 40% of the S&P500 revenue generated outside the US, the S&P500 is no longer the best representation of the US economy. For the Information Technology sector, this can no longer adequately represent the US as 58% of their revenue came from outside the US.
Observation from the chart above:
- The high international sales/high domestic sales index has been showing a falling trend since 2021.
- For this index to fall from over 1.5 (Jan 2021) to under 1.2 (Sep 2022), there are a few factors that could lead to this.
- The magnitude of the rise in international sales is lesser than the magnitude of the rise in domestic sales.
Conclusion - what index can we use apart from S&P500?
Going forward, we need to consider another index as a reflection of the US economy. Perhaps, we need to consider looking at the Wilshire 5000 index.
The Street defines Wilshire 5000 as the following:
The Wilshire 5000 measures the market capitalization of all publicly traded, U.S.-based stocks that trade on major exchanges like the NYSE and Nasdaq. It does not measure the market capitalization of privately traded companies or those that trade on the over-the-counter bulletin board market.
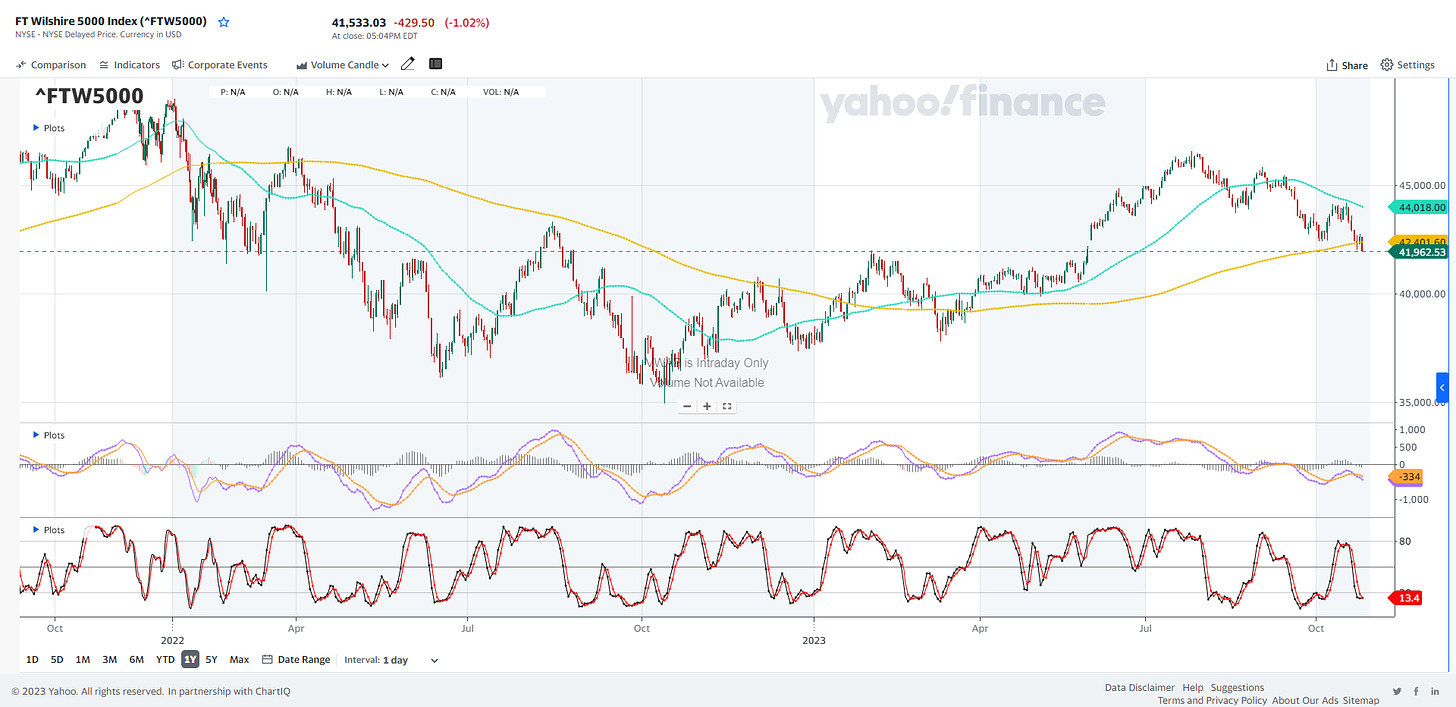
This can be a better look at the overall US economy though it includes some multinational companies (MNCs) that include non-US revenue. From the 1D chart above, Wilshire 5000 is on a downtrend, near a 10% decline, and approaching correction territory (more than a 10% decline from the recent high (after 126 trading days). It may be prudent to monitor as there is a setup of a death cross too - a typically bearish indicator.


Comments
Post a Comment