Websites I use for my trade setup - Part 3 of 4 (01Dec2021)
As part of my qualification of companies, I will use www.Quickfs.net to obtain 10 years overview, income statement, balance sheet, cash flow statement and key ratios. This is to supplement Yahoo Finance that only provide financial data for the last 4-5 years. In general, I am looking for an uptrend and I can “accept” 1 or 2 years of “less than adequate” performance. More importantly, a good company should demonstrate that they can cope with bad times like the Covid 2020 hit 2020-2021 where we should expect quicker than average recovery.
3. Quickfs.net
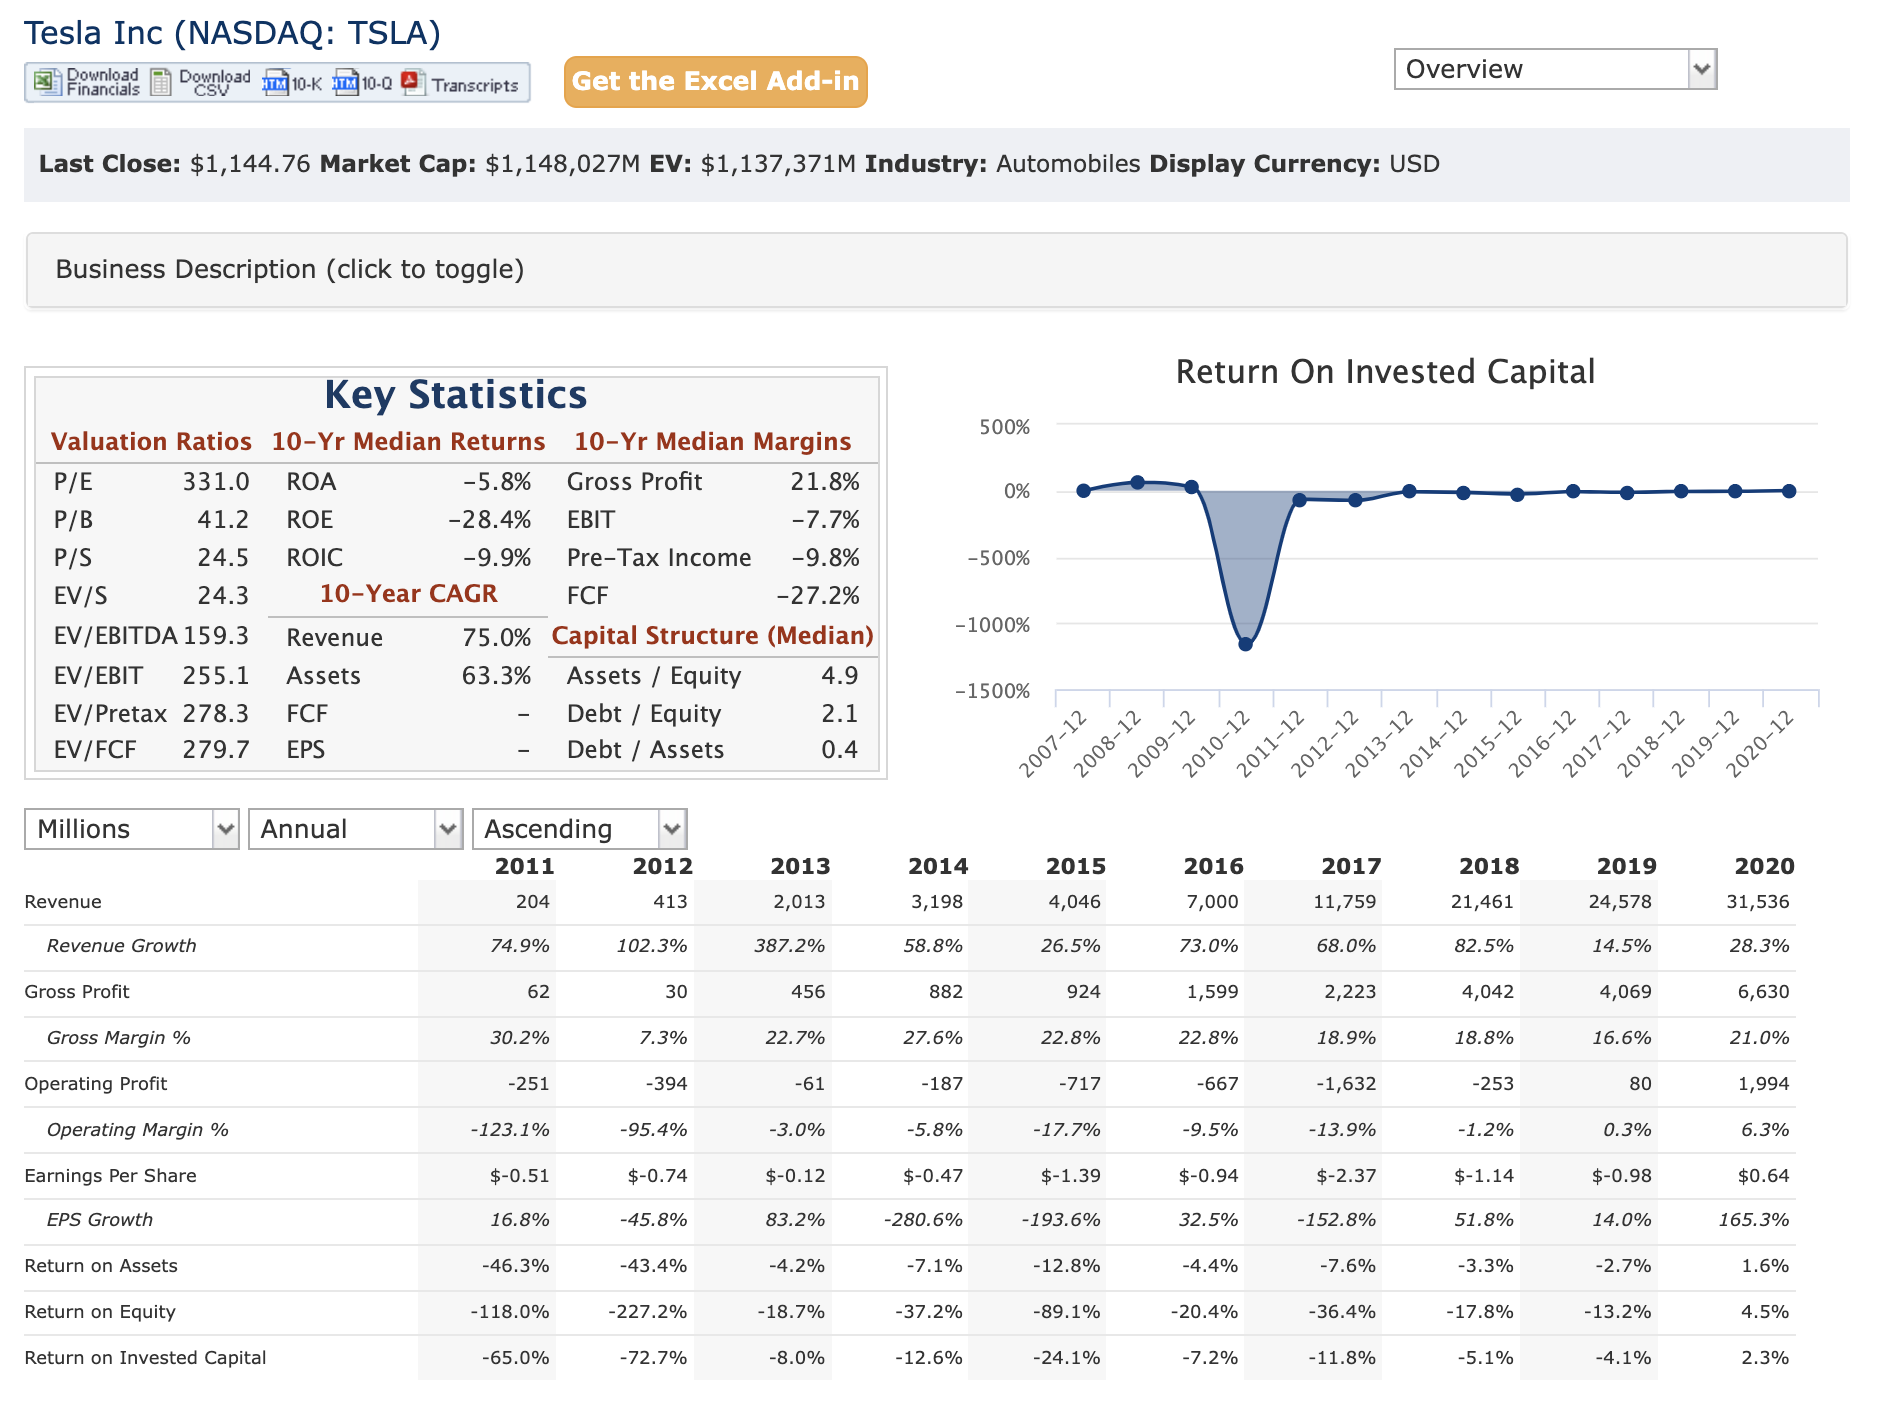
My favourite screen is actually the “overview” page - which shows key ratios (P/E, P/B, P/S), 10-year median returns, margins, 10-year CAGR, key financial info over the last 10 years. In a quick glance, I would be able to get good key information about the business.
Revenue and EPS are good guides about the business but these do not provide enough details into the businesses. The details are needful so that we can buy our positions with confidence.
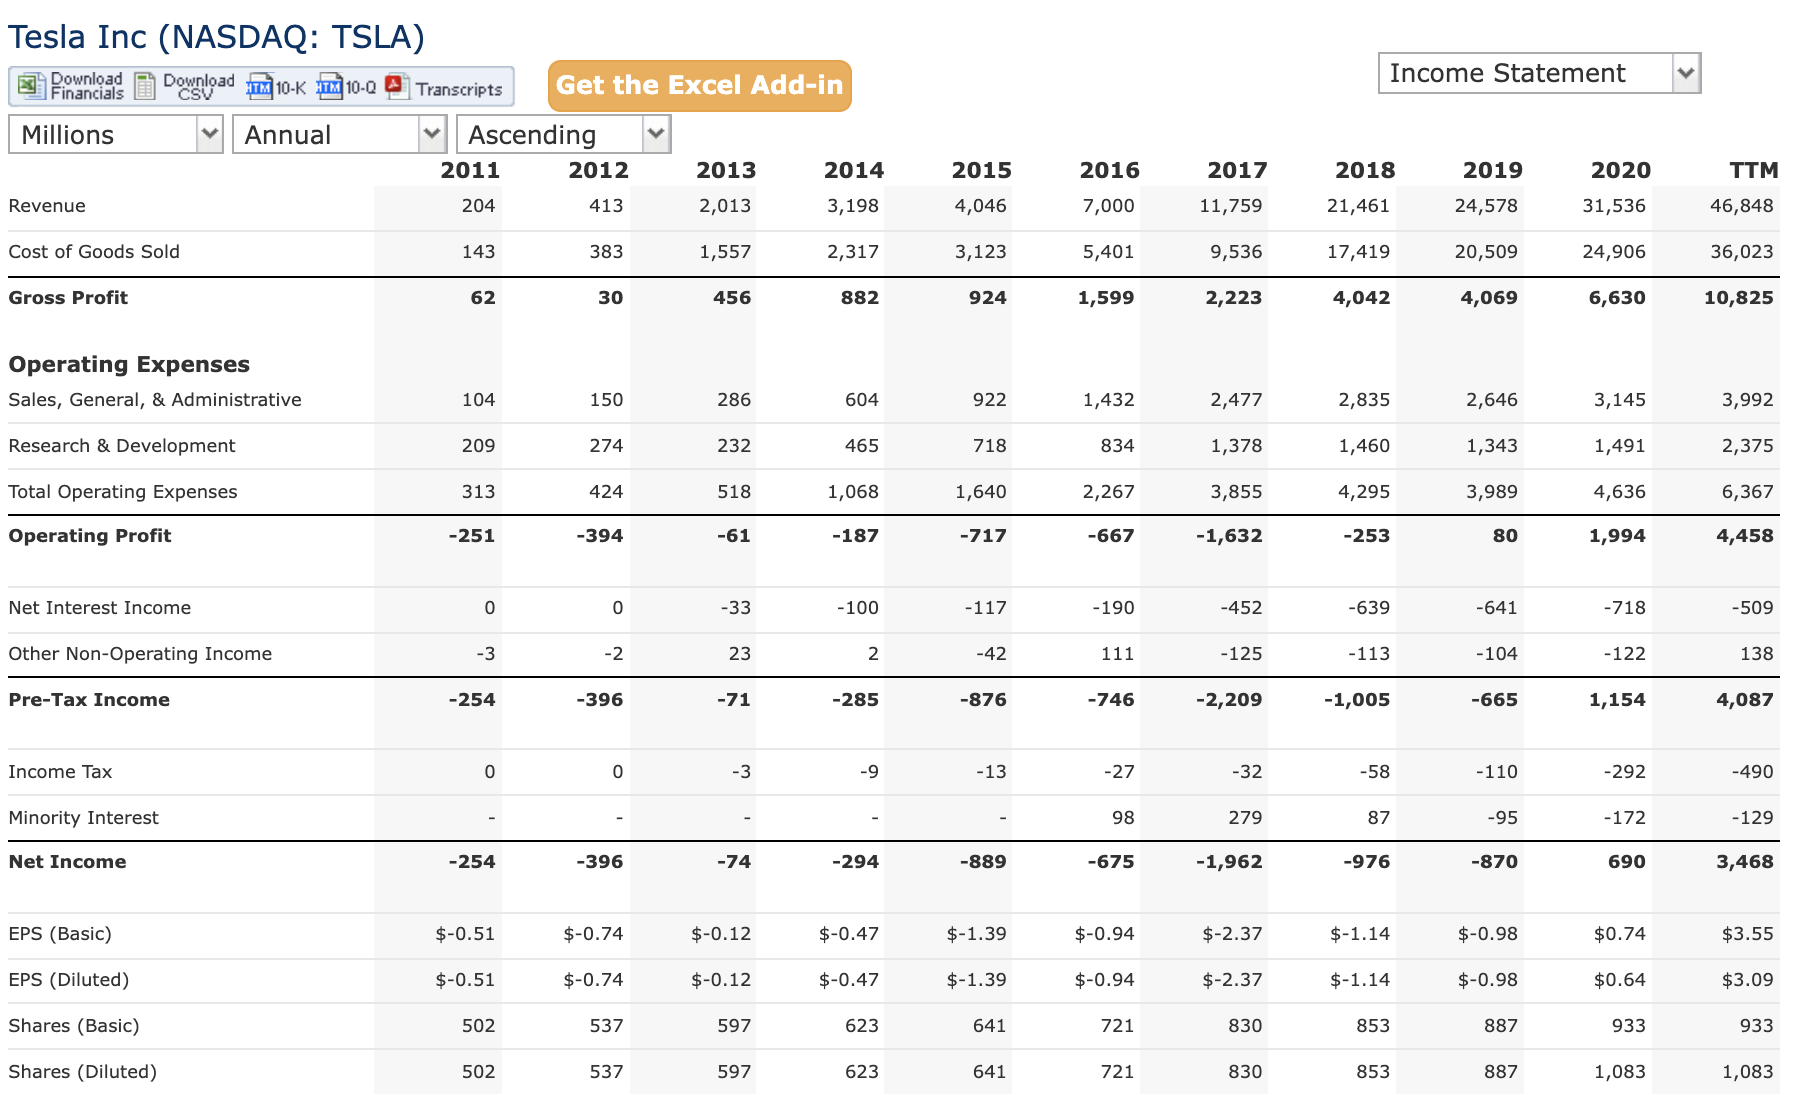
The following shows the income statement where I focus on the revenue, the expenses and net income.
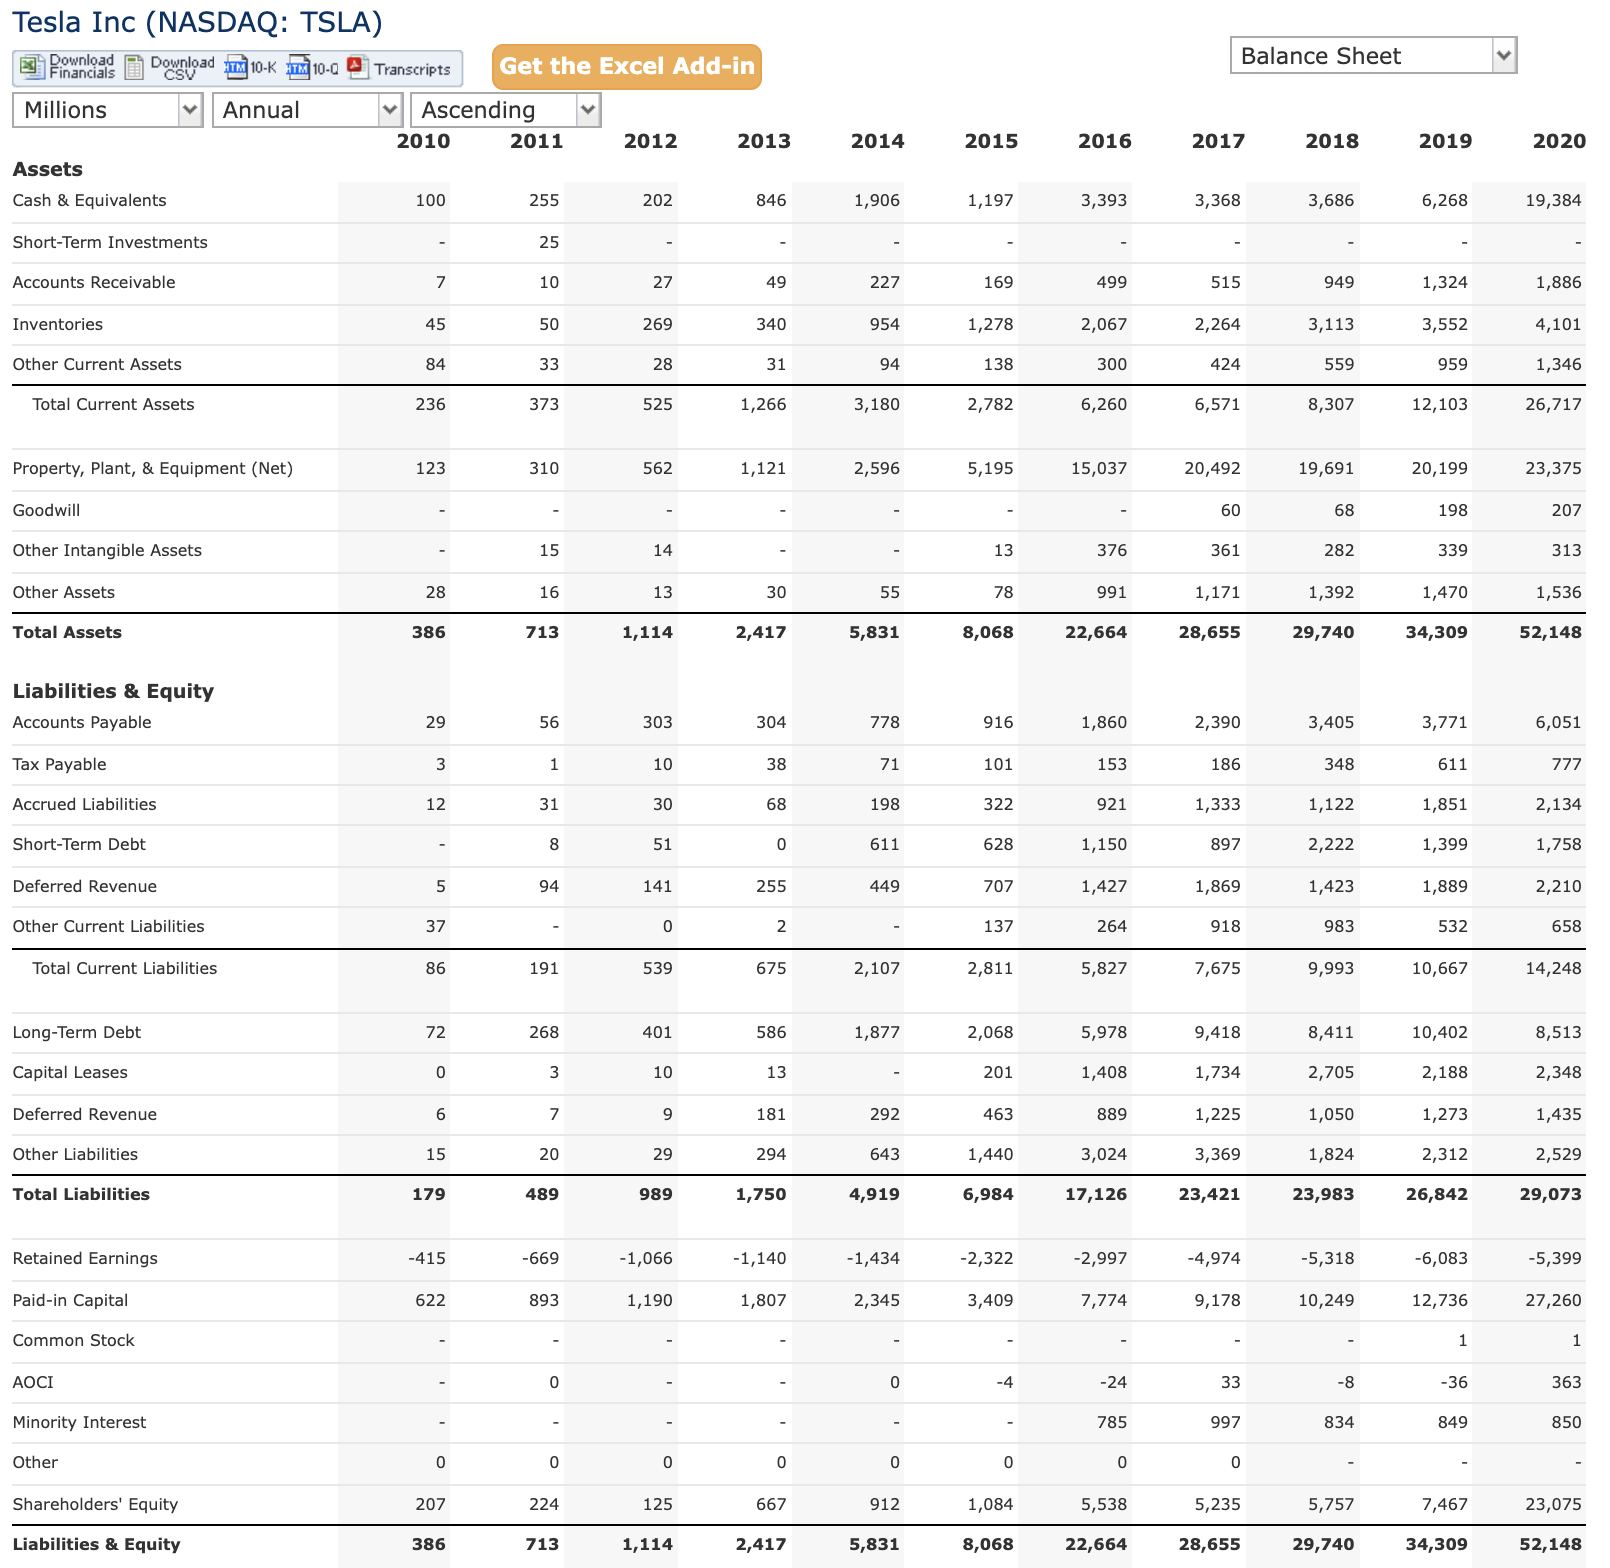
For the balance sheet below, I will look into how they manage their assets, liabilities. Cash & equivalent that is more than total current liabilities is always a welcomed statistic. I look forward to the company paying down its long term debt and reducing overall debt.
The Balance Sheet may not always tell the full picture of how the money is “spent” and thus, we will need to look into cash flow statement to look for this.
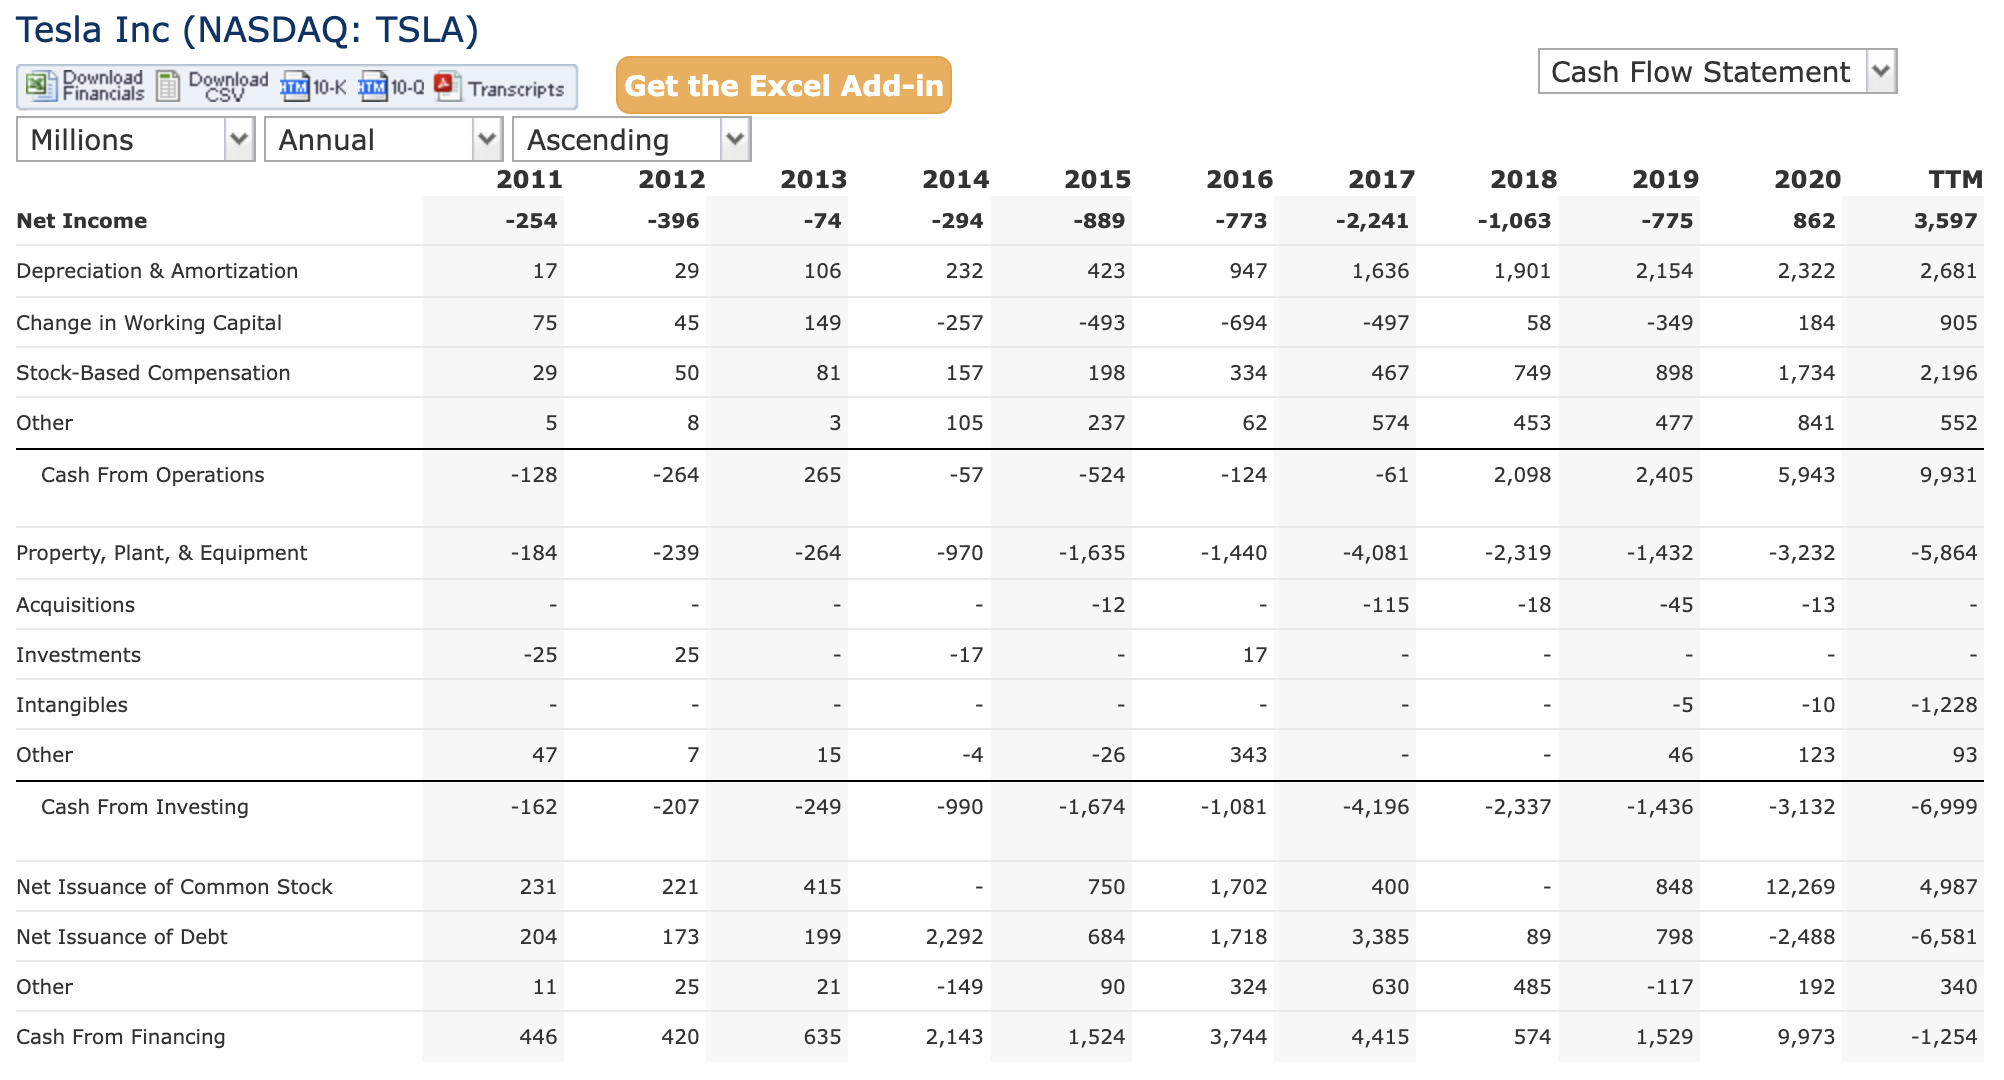
Cash flow comes from 3 sources - operations, investments and financials. Looking at Tesla, they were investing in new plants (Berlin, China, US, etc) as they expand their production. one of the figures that kinda “jumped” at me was the increase of their stock-based compensation.
the net issuance of the common stock shows how money is raised but also raises concerns about “dilution” where profits are shared with more shareholders.
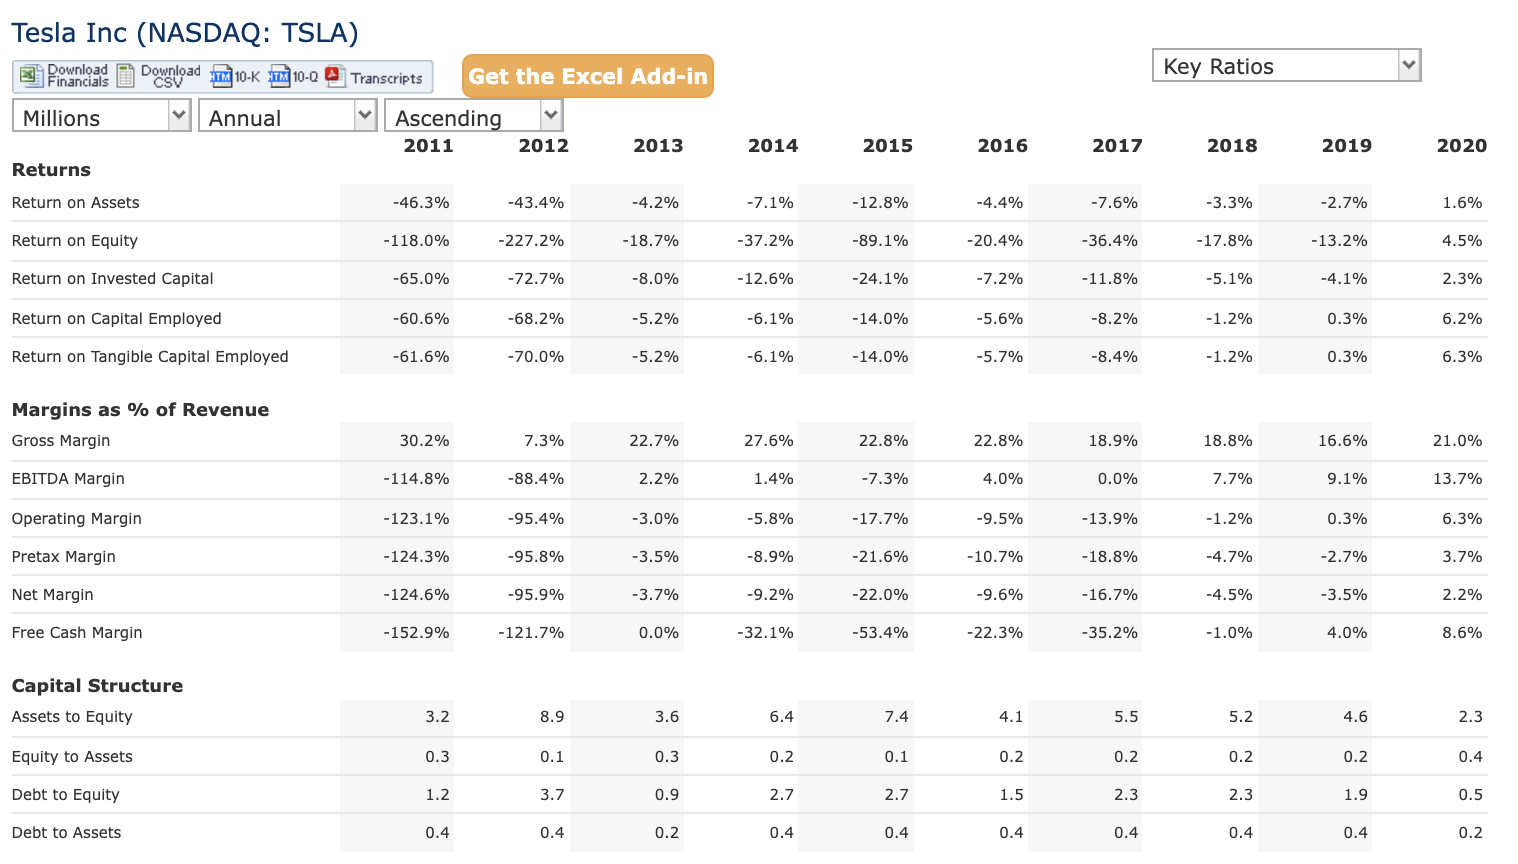
On this page, we will find various key ratios over the last 10 years - giving us a good feel on how the business is doing over time.
For us to become confident of the businesses we invest in, seeing their performance over a 10 years trend would be good - usually, we should be able to see how the company navigate through challenging times.
Overall, quickfs.net is a good way for us to catch a good summary of a business’s performance, with key ratios and financial statistics in a quick glance. However, if we are serious about investing, we will need to deep dive into their annual, quarterly reports so that we can get more information. I trust that this series has been helpful for us who plans to deep dives into businesses.
Here is wishing all happy investing.


Comments
Post a Comment