How I research into companies - using $SRG (28Nov2021)
Seritage Growth Properties (SRG) $Seritage Growth Properties(SRG)$
This stock got my interest as Guy Spier and Mohnish Pabrai own them as per their recent 13F filing. I have been following both investors and appreciate the sharing of their investment insights. Thus, this stock has caught my attention. With this company, I will share my research with companies. This part only looks at their annual performance from recent years (starting 2017 to TTM) with a macro view of their income statement, balance sheet and cash flow statement.
To be more comprehensive, we will need to check on the sector (to ascertain the average industry performance, average metrics like P/E, P/S, P/B, P/FCF and any sector concerns). We would need to look into their annual and quarterly earnings.
Who is SRG?
Seritage Growth Properties is a publicly-traded, self-administered and self-managed REIT with 166 wholly-owned properties and 29 unconsolidated properties totalling approximately 30.4 million square feet of space across 44 states and Puerto Rico. The Company was formed to unlock the underlying real estate value of a high-quality retail portfolio it acquired from Sears Holdings in July 2015. The Company's mission is to create and own revitalized shopping, dining, entertainment and mixed-use destinations that provide enriched experiences for consumers and local communities and create long-term value for our shareholders.
with the economy opening, we can expect more crowds to go back to the malls and thus, this was an area of interest.
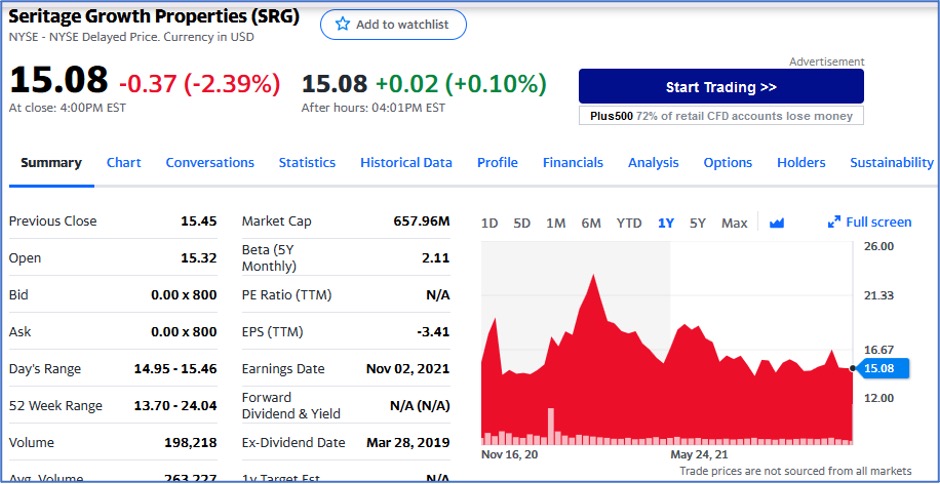
This was taken on 18 Nov 2021 when I first started to find out more about this company.
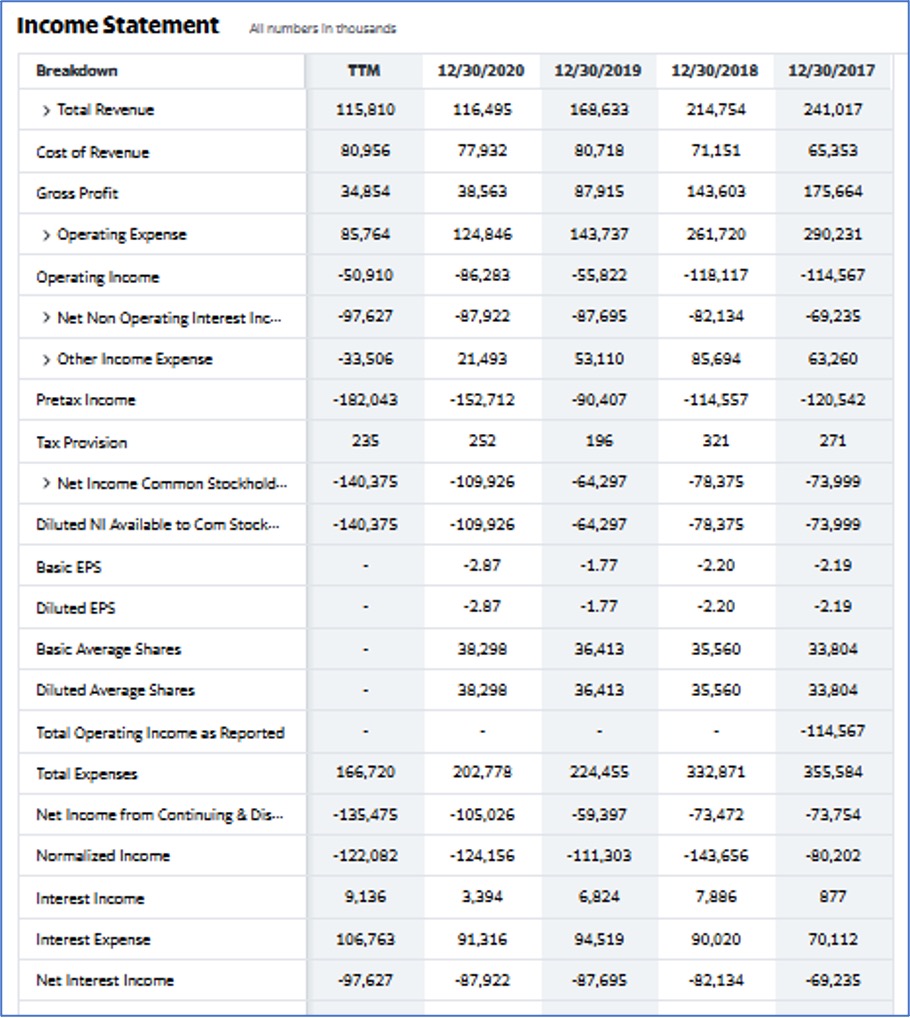
Income Statement
It is worrying that the total revenue has been dropping – from $241M in 2017 to $115M TTM. It is reflected in Basic EPS dropping from -$2.19 in 2017 to -$2.87 in 2020.
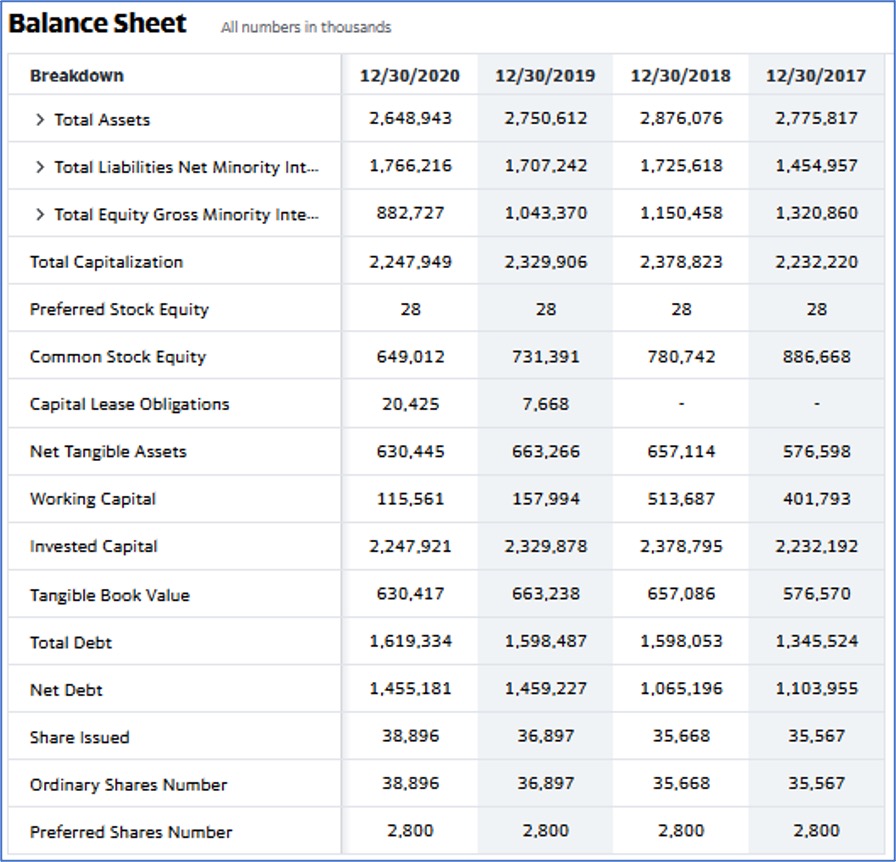
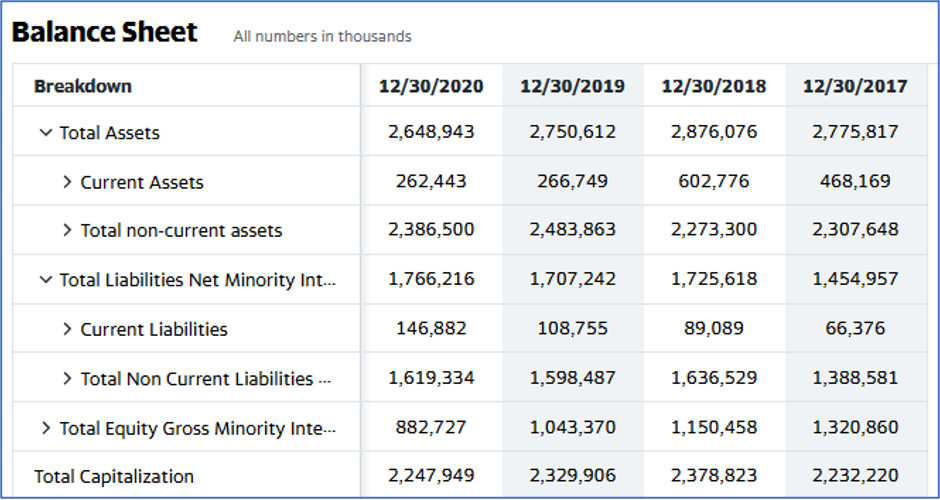
Balance Sheet
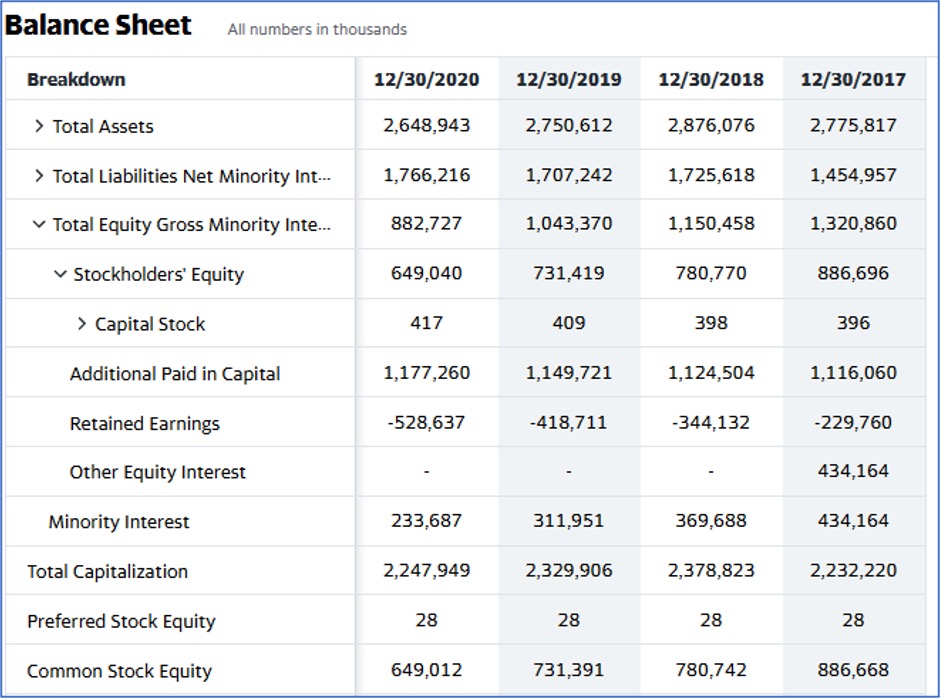
The total asset has been dropping whereas total liabilities have been increasing – it is clear in the net debt that increased from $1,103M (30Dec2017) to $1,455M (30Dec2020)
Non-current liabilities has been on an upward trend from $1,388M (2017) to $1,619M (2020) but total assets have been dropping.
Retained earnings have dropped from a loss of $229M (2017) to a loss of $528M (2020).
Cash Flow
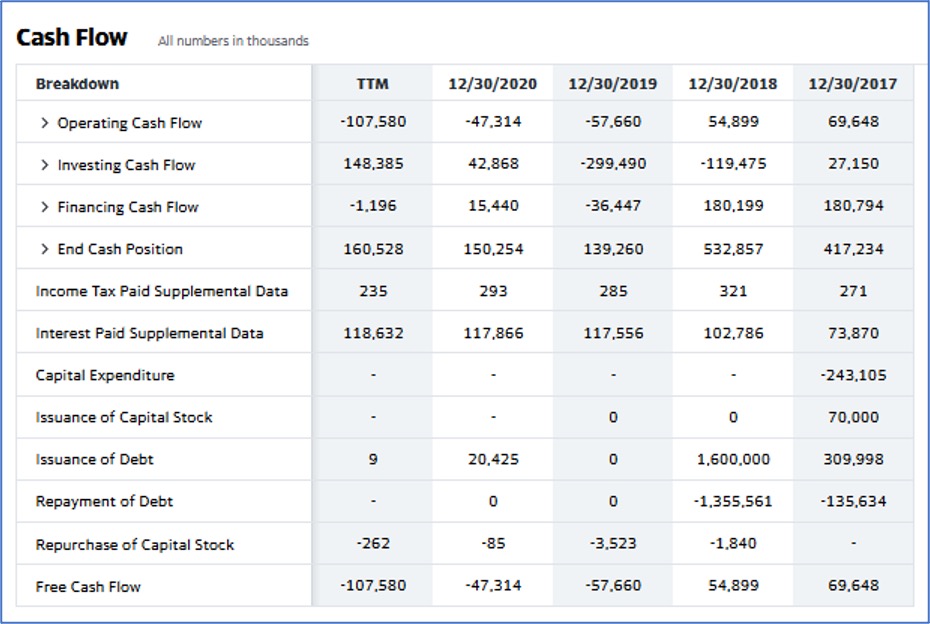
Notable concerns – end cash position has dropped from $417M (2017) to $160M (TTM).
Operating cash flow has been negative since Dec 2019 and currently, it is at -$107M (TTM). Free cash flow went from positive $69M in 2017 to -$107M (TTM)
The concern arises when their FCF is in the negative, providing concerns of the daily running of the business – this can be bridged through loans and debts. In absence of improving top lines and profit margin, the downside looks to be more probable than the upside.
From the review of the last few years’ financial performances, there are some concerns raised. It is recommended to monitor their quarterly earnings as we look out for chances for the management to turn this around. personally, it would be in the category of “let us monitor” stocks. Happy investing all.
This is not financial advice and the info was extracted from Yahoo Finance.
#pabrai #spier #SRG


Comments
Post a Comment